1Department of Bioinformatics, Institute of Biomedical Chemistry, Moscow, RUSSIA
Corresponding author.
Author Notes
Copyright and License information


ABSTRACT
Pathway analysis tools are essential for interpreting high-dimensional multi-omics data. However, while many tools have been developed, their practical usage in applied research pipelines remains unclear, since tools are often cited without being actually used. Here, we systematically evaluated the practical adoption of 28 publicly available software tools designed for multi-omics pathway analysis. We analyzed 18,447 open-access full-text articles published before 2025 and downloaded the corresponding full-texts from the PubMed database. Citations were classified based on their appearance in different sections of each article via the JATSdecoder package. Tools were considered “used” if cited in methodological sections. We report that ClusterProfiler and Pathview are the most frequently used tools, applied in over 80% of citing research articles. Other tools, such as ReactomeGSA and PARADIGM, have high citation counts but were used in fewer than 50% and 20% of cases, respectively. Overall, citation frequency did not reliably reflect practical usage. Our findings highlight a discrepancy between citation and practical adoption of multi-omics pathway analysis tools, emphasizing the need for usage-based evaluation metrics to inform tool selection in bioinformatics.
INTRODUCTION
Pathway analysis has become an indispensable step in the interpretation of high-dimensional molecular data, enabling researchers to move from lists of differentially expressed genes/proteins toward a higher-level understanding of biological mechanisms. By identifying perturbed signaling or metabolic pathways, researchers can uncover insights into disease processes, drug responses, and cellular functions, facilitating the interpretation of omics data.
The advent of multi-omics studies, which integrate data from multiple molecular layers has stimulated the need for sophisticated pathway analysis tools capable of handling heterogeneous datasets. In response to this demand, the research community has developed a plethora of pathway analysis tools tailored for multi-omics integration. Prominent examples include ClusterProfiler,[1] PARADIGM,[2] Pathview,[3] PaintOmics,[4] and ActivePathways.[5] These tools vary in terms of supported data types, statistical approaches, visualization capabilities, and usability.
Several recent reviews have evaluated multi-omics integration tools from methodological perspectives. Maghsoudi et al.[6] provided a comprehensive overview of pathway-analysis approaches, highlighting their assumptions, supported data types, and practical limitations. A classification of integration methods according to translational-medicine objectives was proposed by Athieniti and Spyrou.[7] Morabito et al.[8] provided a summary of algorithmic classes for data-driven omics integration, while network-based frameworks linking multi-omics data to biomarker and interaction discovery were reviewed by Kumar and colleagues.[9]
However, while many of the multi-omics pathway tools are widely cited in the scientific literature, their actual adoption in applied research studies remains unclear. For example, some tools may accumulate citations because of theoretical significance or pioneering contributions to the field, yet their actual integration into research pipelines could be limited. This raises a question: which pathway analysis tools are actively utilized in modern multi-omics research?
To address this gap, we conducted a systematic evaluation of the practical usage of multi-omics pathway analysis tools. Rather than aiming to compile the most up-to-date list of tools, we focused on a set of methods that are already established in the field and have had sufficient time to accumulate citations and be evaluated in practical applications. For this reason, we based our analysis on the well-curated overview[6] of multi-omics pathway analysis tools. Using this reference set, we examined citations in open-access research papers, distinguishing between citations in the Methods section (indicating actual tool employment) and those in the Introduction or Discussion sections, suggesting use in literature reviews. Our goal was to identify the “working horses” of multi-omics pathway analysis and provide a clearer picture of their practical impact. To our knowledge, this is the first quantitative analysis of the gap between citation popularity and actual use of pathway analysis tools in multi-omics studies.
METHODOLOGY
We compiled a list of pathway analysis tools designed for or adaptable to multi-omics data. Our goal was to select tools that were published not earlier than three years ago. We based our study on a comprehensive survey[6] of 32 tools, but removed tools that were not freely available to the public since limited accessibility could introduce bias into the assessment of real-world usage. We chose to retain PARADIGM[2] tool in the analysis, which is not currently publicly available, but was accessible in the past.
For each tool, we searched for open-access papers that cited the tool’s primary publication(s), excluding paywalled articles to ensure the reproducibility of our analysis. We used PubMed to identify relevant publications, focusing on papers published before 2025 (the citation collection was carried out in March-April 2025).
The search was restricted to English-language papers. When a tool was described in multiple publications, we included all relevant ones. For example, for Mergeomics software, we used both the original paper[10] describing version 1.0 and the following paper[11] describing version 2.0. At the same time, we ensured that the selected methods were explicitly designed for multi-omics analysis, e.g. in the case of GeneTrail, we excluded the earliest publication[12] because it described a single-omics version of the tool.
For each publication, we retrieved the corresponding full-text XML file in NISO-JATS format from the PubMed Central database (“ANSI/NISO Z39.96-2024, JATS: Journal Article Tag Suite, version 1.4”). Papers for which the publisher did not permit full-text XML download were excluded from the analysis. The downloaded XML files were processed using the JATSdecoder package, which extracts structured metadata, abstracts, sectioned body text, and reference lists from JATS-formatted articles.[13]
Paper was considered a research article if the `article-type` tag was equal to `Research Article`. For research articles, we determined whether the tool was actually used in the study by identifying citations that appeared within methodological sections of the text. This was done by scanning section titles using the regular expression ‘method procedur protocol’. Citations found within these sections were considered indicative of real tool usage. In cases where a paper cited multiple publications describing the same tool (e.g., both versions 1.0 and 2.0), we retained only one reference to avoid duplication in citation counts. Non-research articles were included as publications that cite tools without actual use and were accounted for in the final statistics.
We compiled a list of freely available pathway analysis tools capable of performing multi-omics analysis (Table 1). The final list included 28 tools described in 36 papers. Using PubMed, we retrieved all open-access publications citing each tool, resulting in 18,447 full-text articles. After excluding papers for which the publisher did not permit full-text download and papers citing multiple publications describing the same tool, the final dataset comprised 16,285 articles. The earliest citing paper dates to 2006, and the most recent to 2024.
| Tool name | References | Avg citations | Tool usage fraction, % |
|---|---|---|---|
| Gene-level, p -value-based approaches |
|||
| KaPPA-View | [14] | 1.2 | 0 |
| MAPE | [15] | 1.8 | 5.0 |
| INMEX | [16] | 7 | 64.5 |
| 3Omics | [17] | 6.6 | 8.9 |
| IncroMAP | [18] | 2.2 | 60.0 |
| ActivePathways | [5] | 14.6 | 44.0 |
| mitch | [19] | 5 | 75.0 |
| iODA | [20] | 1.25 | 0 |
| Pathway-level, p -value-based approaches |
|||
| IMPaLA | [21] | 15.2 | 54.5 |
| iPEAP | [22] | 0.6 | 0 |
| MarVis-Pathway | [23] | 2.2 | 60.0 |
| BLMA | [24] | 1 | 30.0 |
| GeneTrail | [12] | 17.8 | 69.3 |
| Mergeomics | [10,11] | 11.6 | 39.3 |
| Pathview | [3,25] | 152.4 | 82.4 |
| PaintOmics | [4,26,27] | 19.6 | 19.3 |
| ReactomeGSA | [28,29] | 22.4 | 50.2 |
| multiGSEA | [30] | 10.8 | 43.1 |
| pathwayMultiomics | [31] | 2.7 | 0 |
| CPA | [32] | 3 | 25.0 |
| clusterProfiler | [1,33] | 2684.8 | 90.1 |
| Graph transformation-based approaches | |||
| PARADIGM | [2] | 19.4 | 18.4 |
| Subpathway-GM | [34] | 4.2 | 20.2 |
| microGraphite | [35] | 1.4 | 20.0 |
| MOSClip | [36] | 2 | 8.3 |
| IMPRes-Pro | [37] | 0.8 | 30.0 |
| Machine-learning-based approaches | |||
| GSOA | [38] | 0.6 | 0 |
| pathwayPCA | [39] | 1.4 | 20.0 |
Two bibliometric indicators were employed: number of citations per year, representing the yearly count of papers citing the tool’s primary publication(s), and (2) fraction of papers actually employing the tool per year, defined as the ratio of research articles citing the tool in methodological sections to the total number of citing papers for the same year. The first metric captures the temporal dynamics of a tool’s visibility in the literature, while the second reflects its real-world adoption in experimental workflows.
Citation collection and analysis were performed using custom Python and R scripts, which are freely available upon request from the authors.
RESULTS
We have analyzed 16,285 full-text articles citing 28 multi-omics pathway tools, see Materials and Methods and Figure 1.
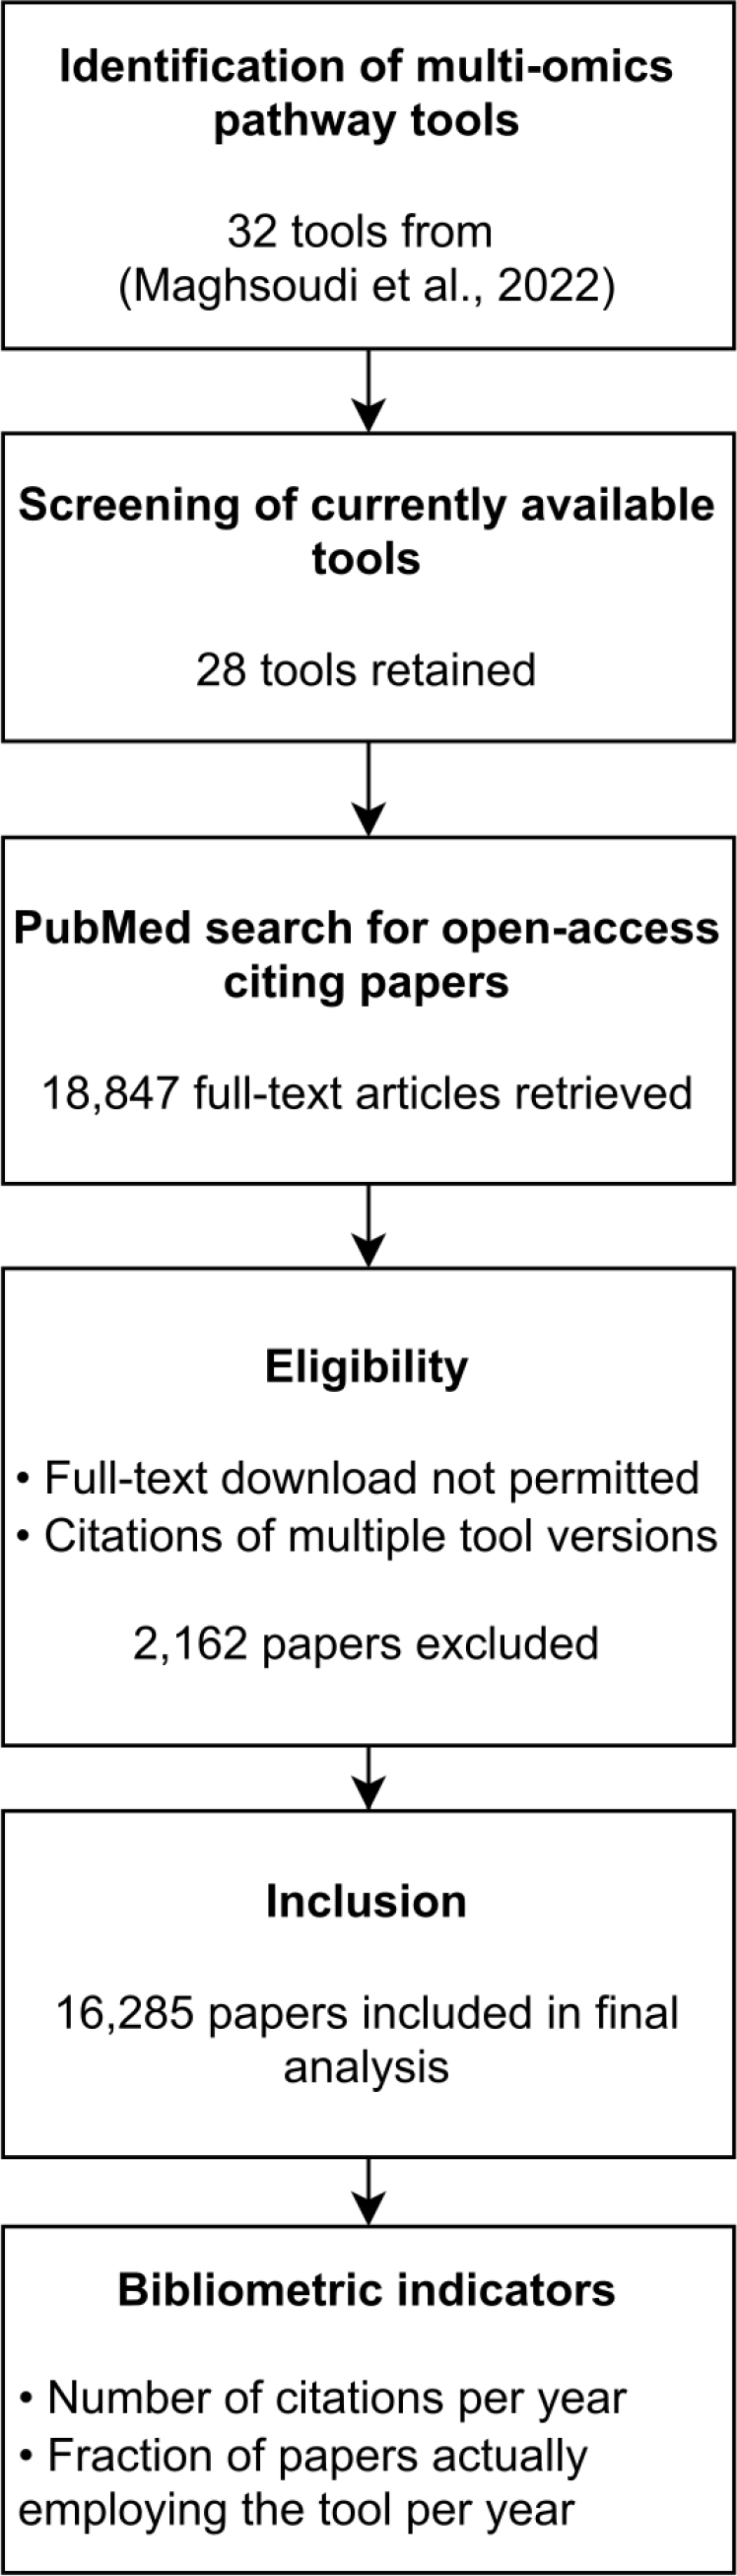
Figure 1:
Flow diagram of the conducted analysis: identification of multi-omics pathway tools, PubMed search for citing papers, and calculation of bibliometric indicators.
Citation Per Year
ClusterProfiler tool led with 14,346 citations, while IMPRes-PRO had the fewest at 4 citations. Following the classification proposed by Maghsoudi et al.,[6] we categorized pathway analysis tools into four groups and visualized corresponding citation trends, see Figure 2.
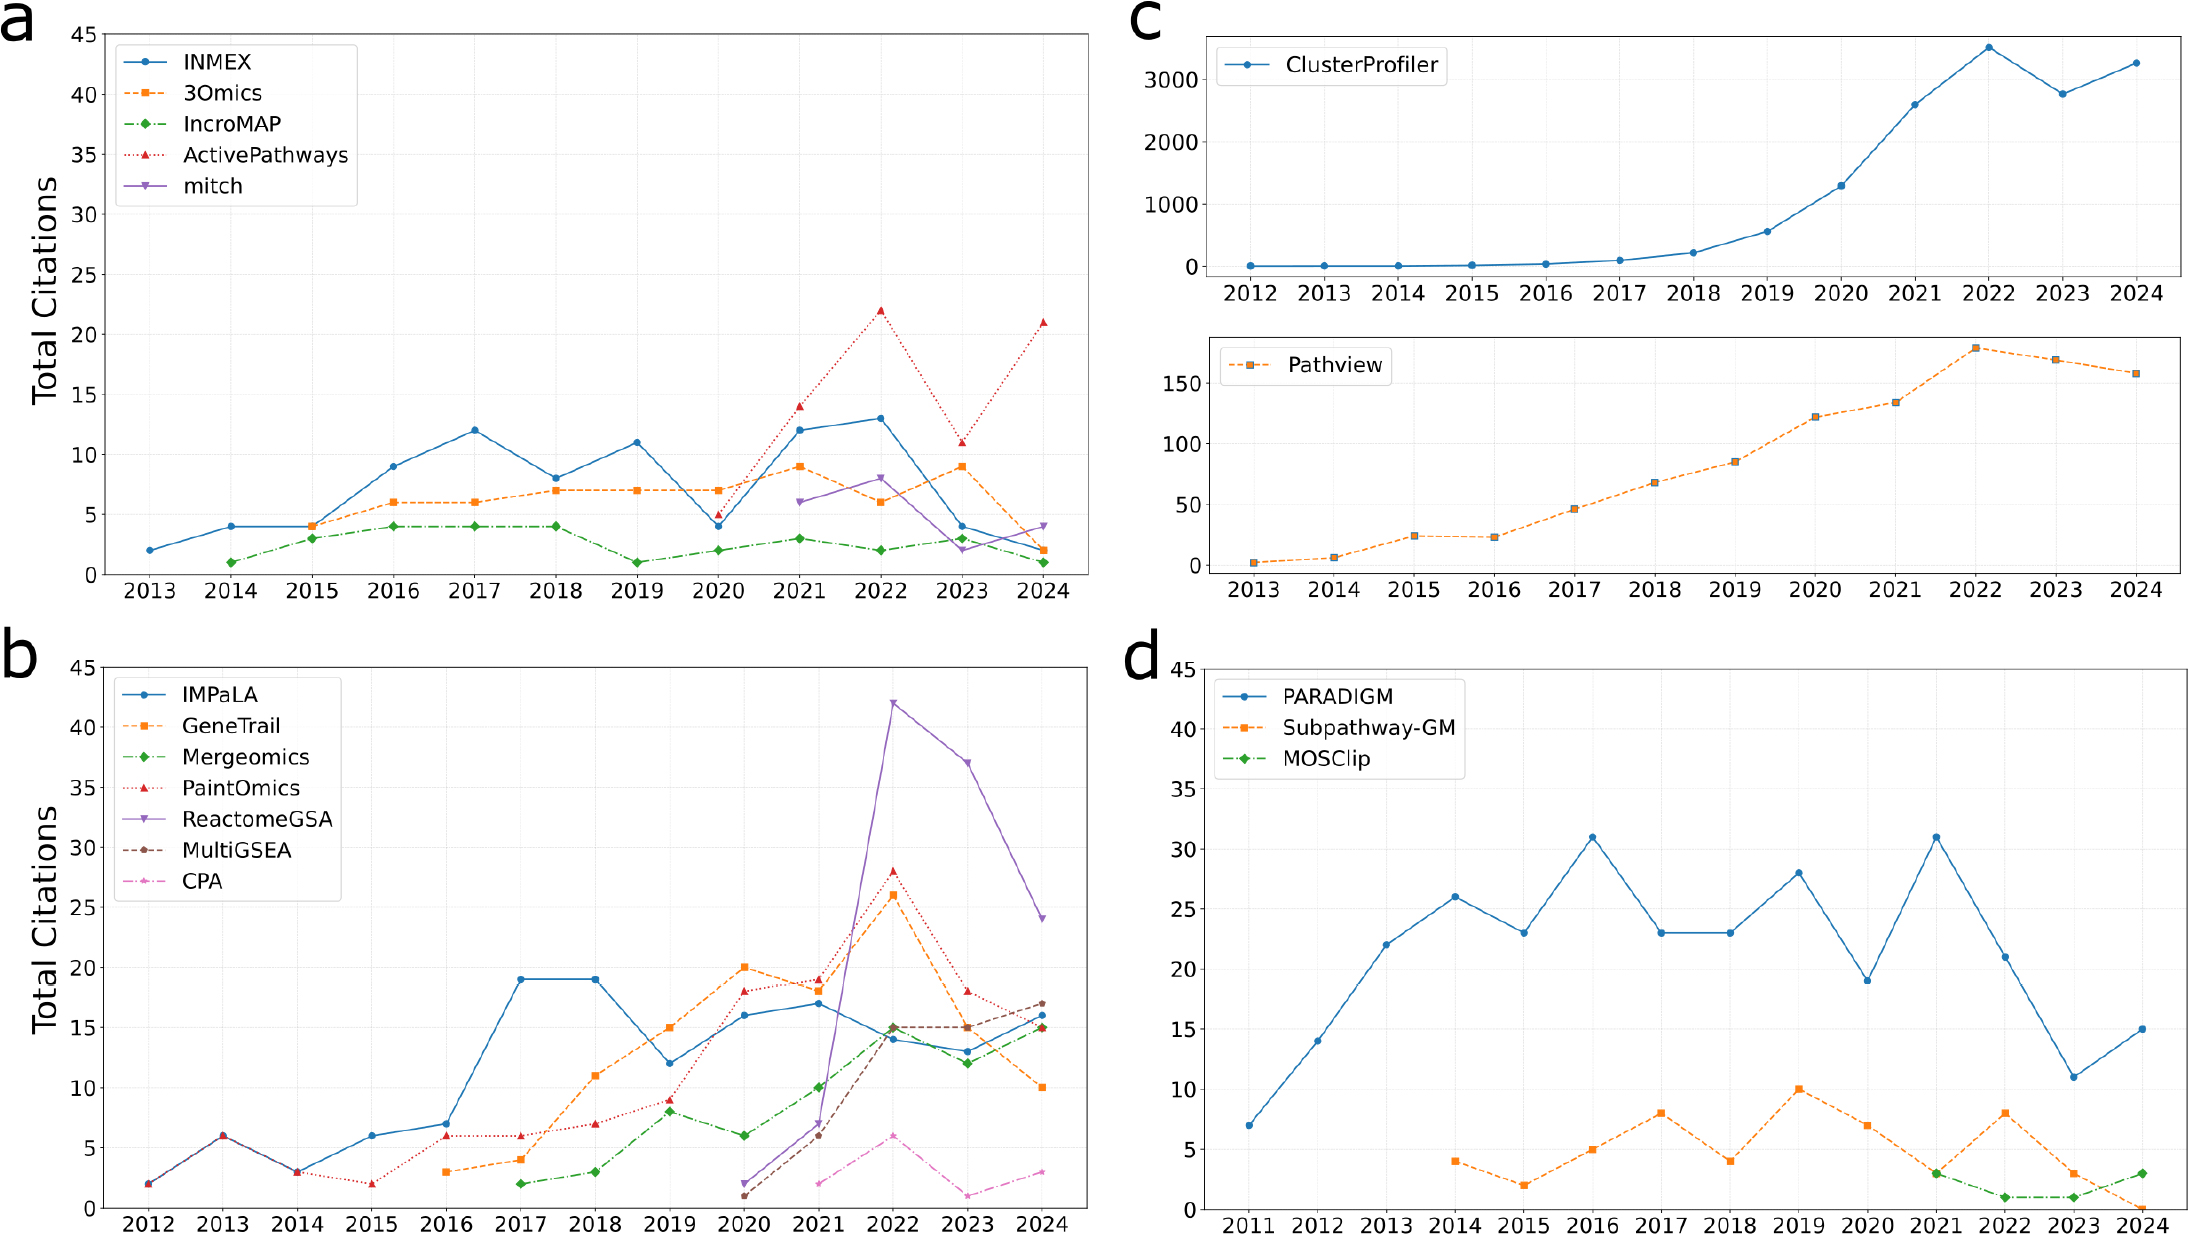
Figure 2:
Annual citation counts for pathway analysis tools grouped by methodological approach. For each panel, the X-axis represents the publication year, and the Y-axis shows the total number of citations per year. All panels except (c) use the same Y-axis scale to facilitate comparison across categories. To reduce visual clutter, only tools with an average of at least two citations per year over the last five years were included. (a) Gene-level, p-value-based integrative approaches, (b) Pathway-level, p-value-based integrative approaches, (c) ClusterProfiler and Pathview tools, both pathway-level approaches, (d) Graph transformation-based integrative approaches.
The first group is represented with gene-level, p-value-based integrative approaches and includes a total of 8 tools. Most tools in this group like INMEX, 3Omics, IncroMAP and mitch have modest citation rates of 2-7 per year (Figure 2a). The exception is the ActivePathways tool, originally developed in 2020, that has a higher citation level with 14.6 citations per year for the last five years. Other tools in this group, including KaPPA-View, MAPE, and iODA, are cited on average less than 2 times per year.
The second group of tools (Figure 2b) is represented with pathway-level, p-value-based integrative approaches. This is the largest group, comprising 13 tools. The following tools show similar citation level, not exceeding 25 citations per year for the last five years: IMPaLA, GeneTrail, Mergeomics, Pathview, PaintOmics, ReactomeGSA, MultiGSEA, CPA. Less frequently cited tools, including iPEAP, MarVis-Pathway, BLMA, and pathwayMultiomics, average fewer than 3 citations annually.
Two tools in this group exhibit exceptional citation patterns (Figure 2c). The first one, Pathview, available both as a standalone R-package[3] and its Web-based version[25] averages 152 citations per year over the past five years. The second tool, the ClusterProfiler R-package[1,33] is the absolute leader among all other tools with 2685 citations per year. However, citation growth for both tools has plateaued over the last two years.
The third group of tools (Figure 2d) consists of graph transformation-based approaches: PARADIGM with 19.4 citations per year and Subpathway-GM with 4.2 citations per year. The low-cited tools include microGraphite, MOSClip, and IMPRes-Pro with fewer than two citations per year.
The fourth group comprises two machine-learning-based tools, both low-cited: PathwayPCA with 1.4 citations per year and GSOA with 0.6 citations per year.
Overall, the two most cited tools for multi-omics pathway analysis (PathView and ClusterProfiler) belong to the pathway-level p-value-based approaches. Furthermore, we do not observe any method for pathway analysis showing a significant increase in the number of citations for the last five years. Both Pathview and ClusterProfiler peaked in citation activity by 2022 and have reached a plateau since then.
Fraction of papers actually employing the tool
We then turned to the assessment of the actual usage of pathway analysis tools in multi-omics research. For each open-access publication citing one of the tools, we determined whether the tool was cited in the Methods section (indicating actual tool employment), or elsewhere, such as in the Introduction or Discussion, where tools are often mentioned in the context of general literature. The proportion of citations representing real-world tool use for every year is plotted on Figure 3.
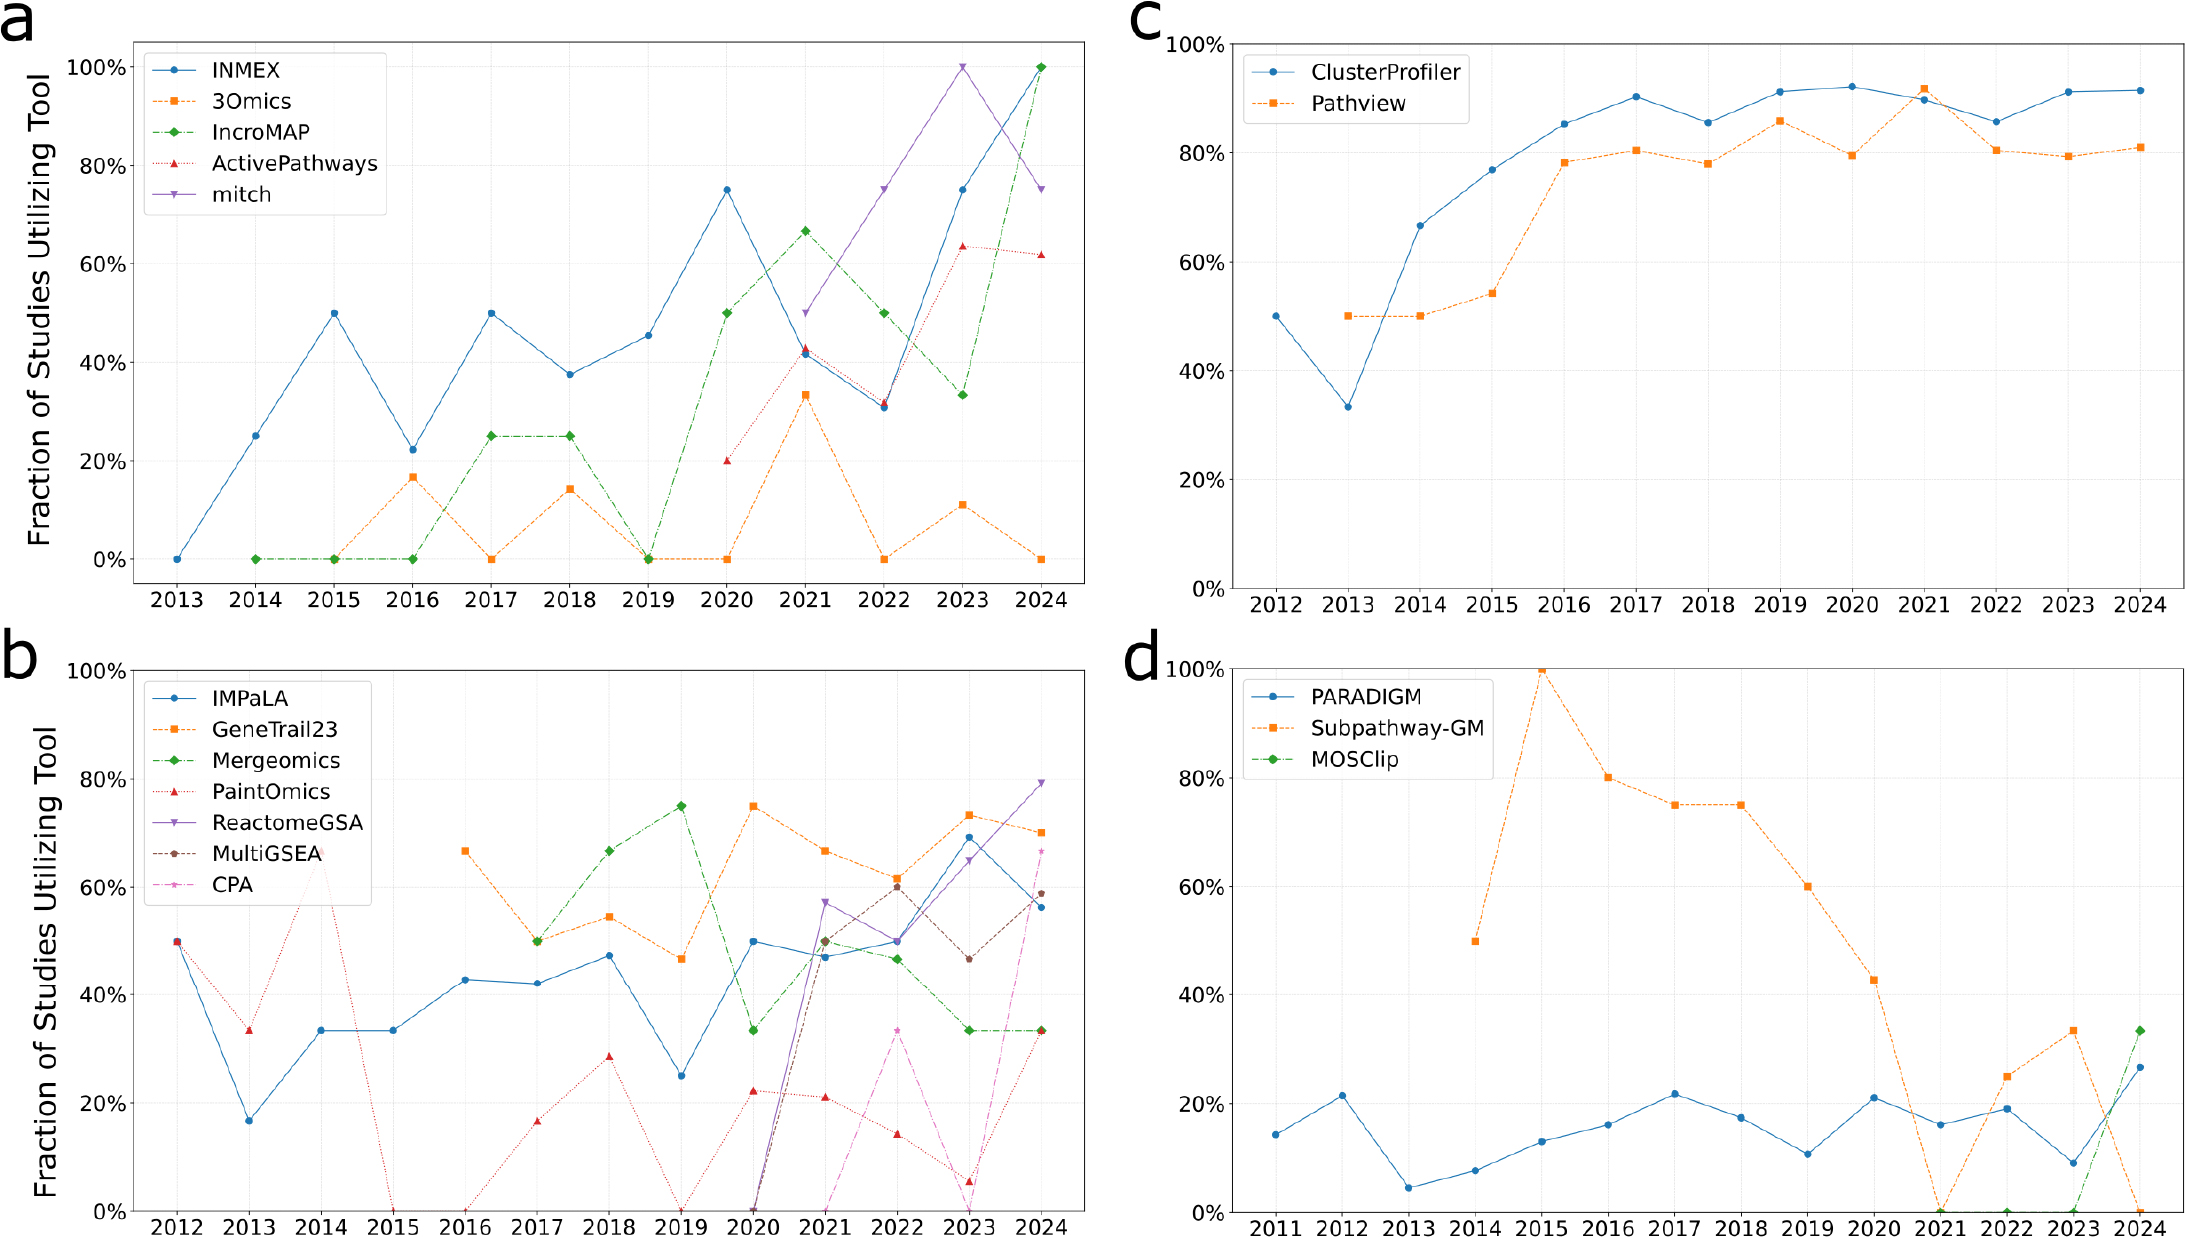
Figure 3:
Annual trends showing the proportion of citing publications in which each pathway analysis tool was actually used, grouped by methodological approach. For each panel, the X-axis represents the publication year, and the Y-axis represents the fraction of citing publications in which the tool was actually used. To reduce visual clutter, only tools with an average of at least two citations per year over the last five years were included. (a) Gene-level, p-value-based integrative approaches, (b) Pathway-level, p-value-based integrative approaches, (c) ClusterProfiler and Pathview tools, both pathway-level approaches, (d) Graph transformation-based integrative approaches.
Among gene-level, p-value-based tools (Figure 3a), 3Omics exhibited the lowest practical usage over the past five years, with only 9% of citations in Methods sections. Other tools in this category, despite lower citation counts, were actually employed in 60-75% of cases. ActivePathways, the most cited tool in this group, was practically applied in 44% of publications, showing a rising trend in usage.
For the pathway-level, p-value-based integrative approaches (Figure 3b and 3c), the most cited tools, ClusterProfiler and PathView were actually used in 90% and 82% of papers. Other tools in this category were utilized in approximately 50% of cases. Paintomics and CPA showed the lowest practical usage, with only 19% and 25% of citations in Methods sections, respectively.
Graph-transformation-based tools generally demonstrated low practical usage (Figure 3d). For instance, PARADIGM, despite relatively high citation counts, was actually used in only 18% of papers. Subpathway-GM showed a notable decline, dropping from 78% practical usage in 2015-2019 to 20% in 2020-2024.
Validation of Tool Usage Detection Method
We understand that the technique we used to determine whether a tool was actually employed in a study is not bias-free. For example, a citation appearing in the Methods section does not always indicate true usage of the tool. In some cases, tools may be mentioned for conceptual comparison or cited as part of a general methodological background. For instance, Kaever et al.[23] cited the MAPE algorithm[15] in the Methods section as a reference to the idea of meta-analysis, without actually applying MAPE in the study.
To assess the accuracy of our estimate of actual tool adoption, we conducted a manual validation. A total of 100 articles were reviewed to confirm whether the tool was actually employed in the paper. Out of these, 89 cases were correctly identified as either true positives or true negatives. There were 4 false positives, where a citation was incorrectly classified as actual usage, and 7 false negatives, where actual usage was missed. Based on this validation, the accuracy of our method for detecting real tool usage was estimated at 89%.
DISCUSSION
Longitudinal analyses of scientific publications offer a powerful way to reveal trends in biomedical research.[40] Building on this concept, our study systematically examined open-access research articles to assess the employment of multi-omics pathway analysis tools.
We aimed to distinguish between tools that are consistently applied in real-world multi-omics studies and those whose recognition remains largely theoretical. Rather than relying solely on citation counts, we analyzed where in the article each tool was cited, specifically focusing on whether the citation occurred in the Methods section, which we interpret as a proxy for actual use. To the best of our knowledge, this is the first systematic effort to quantitatively assess the gap between citation-based popularity and real-world application of pathway analysis tools in multi-omics studies.
We developed a custom pipeline leveraging full-text articles in NISO-JATS format available from PubMed Central. This approach allowed us to extract structured article metadata, body sections, and inline citations. While there are related efforts such as the OpCitance project,[41] which annotates over 137 million in-text citations across 2 million articles with high precision, its data only covers publications up to 2019. In contrast, our dataset includes articles up to the end of 2024, offering a more current view of tool usage trends.
Our findings highlight a discrepancy between citation frequency and actual tool application. While some tools enjoy high overall citation counts due to their conceptual importance or early entry into the field, this does not always translate to widespread practical use. For example, tools such as ReactomeGSA and PARADIGM, despite receiving considerable attention in the literature, showed relatively low actual usage rates – under 50% and 20%, respectively.
Only two tools, namely ClusterProfiler and Pathview, emerged as clear “workhorses” in the field of multiomics pathway analysis. Both tools are cited in hundreds to thousands of papers annually and are actually employed in over 80% of cases. However, the rate of citation growth for both tools has plateaued over the past two years, suggesting that their adoption may have reached a saturation point. This stabilization may indicate that researchers are beginning to explore newer alternatives as the field evolves.
Our analysis has certain limitations. First, the method we used to detect whether a tool is actually employed in the paper is not perfectly accurate, the manual validation showed an overall accuracy of 89%. Nevertheless, our goal was not the absolute precision but rather the identification of general trends across the field. Second, our analysis is restricted to open-access publications and tools that are publicly available. This could introduce bias by underestimating the presence of paywalled papers or the practical use of proprietary software. Third, we limited our evaluation to the pathway tools that had already gained recognition in the community. The tools included were drawn from a comprehensive review[6] published in 2022, ensuring sufficient citation history for trend analysis. As a result, recently published tools were excluded due to insufficient data for evaluation, regardless of their potential. Finally, although the explored tools support multi-omics, they may have been used for single-omics analysis in some papers.
Our approach could be extended in several ways. For instance, one may exclude papers where at least one author overlaps with the original authors of the tool. This stricter criterion would confirm that the tool is used independently of its developers. Furthermore, our methodology can be extended to analyze other categories of omics-processing software beyond pathway analysis, such as network inference or variant calling.
Overall, we propose that future benchmarking efforts include both bibliometric indicators and usage-based metrics. Recognizing the tools that are genuinely integrated into research pipelines will support better practices in tool development and dissemination.
CONCLUSION
This study offers a critical look at the adoption of pathway analysis tools in multi-omics research. By distinguishing between citation and practical use, we identify tools that are truly embedded in the current pipelines for omics data interpretation. Our findings aim to guide researchers toward more informed tool selection.
Cite this article:
Pyatnitskiy M, Poverennaya E. From Citation to Application: A Usage-Based Assessment of Pathway Analysis Methods in Multi-Omics Research. J Scientometric Res. 2025;14(3):x-x.
ACKNOWLEDGEMENT
The work was performed within the framework of the Program for Basic Research in the Russian Federation for a long-term period (2021-2030) (№122030100168-2). The study utilized the equipment of “Human Proteome” Core Facilities of the Institute of Biomedical Chemistry (Russia).
The work was performed within the framework of the Program for Basic Research in the Russian Federation for a long-term period (2021-2030) (№122030100168-2). The study utilized the equipment of “Human Proteome” Core Facilities of the Institute of Biomedical Chemistry (Russia).
References
- Yu G, Wang LG, Han Y, He QY.. ClusterProfiler: an R package for comparing biological themes among gene clusters.. OMICS A J Integr Biol.. 2012;16(5):284-7. [PubMed] | [CrossRef] | [Google Scholar]
- Vaske CJ, Benz SC, Sanborn JZ, Earl D, Szeto C, Zhu J, et al. Inference of patient-specific pathway activities from multi-dimensional cancer genomics data using PARADIGM.. Bioinformatics.. 2010;26(12):i237-45. [PubMed] | [CrossRef] | [Google Scholar]
- Luo W, Brouwer C.. Pathview: an R/Bioconductor package for pathway-based data integration and visualization.. Bioinformatics.. 2013;29(14):1830-1. [PubMed] | [CrossRef] | [Google Scholar]
- Hernández-De-Diego R, Tarazona S, Martínez-Mira C, Balzano-Nogueira L, Furió-Tarí P, Pappas GJ, et al. PaintOmics 3: A web resource for the pathway analysis and visualization of multi-omics data.. Nucleic Acids Res.. 2018;46(W1):W503-9. [PubMed] | [CrossRef] | [Google Scholar]
- Paczkowska M, Barenboim J, Sintupisut N, Fox NS, Zhu H, Abd-Rabbo D, et al. Integrative pathway enrichment analysis of multivariate omics data.. Nat Commun.. 2020;11(1):735 [PubMed] | [CrossRef] | [Google Scholar]
- Maghsoudi Z, Nguyen H, Tavakkoli A, Nguyen T.. A comprehensive survey of the approaches for pathway analysis using multi-omics data integration.. Brief Bioinform.. 2022;23(6):bbac435 [PubMed] | [CrossRef] | [Google Scholar]
- Athieniti E, Spyrou GM.. A guide to multi-omics data collection and integration for translational medicine.. Comput Struct Biotechnol J.. 2023;21:134-49. [PubMed] | [CrossRef] | [Google Scholar]
- Morabito A, De Simone G, Pastorelli R, Brunelli L, Ferrario M.. Algorithms and tools for data-driven omics integration to achieve multilayer biological insights: a narrative review.. J Transl Med.. 2025;23(1):425 [PubMed] | [CrossRef] | [Google Scholar]
- Kumar R, Romano JD, Ritchie MD.. Network-based analyses of multiomics data in biomedicine.. BioData Min.. 2025;18(1):37 [PubMed] | [CrossRef] | [Google Scholar]
- Shu L, Zhao Y, Kurt Z, Byars SG, Tukiainen T, Kettunen J, et al. Mergeomics: multidimensional data integration to identify pathogenic perturbations to biological systems.. BMC Genomics.. 2016;17(1):874 [PubMed] | [CrossRef] | [Google Scholar]
- Ding J, Blencowe M, Nghiem T, Ha SM, Chen YW, Li G, et al. Mergeomics 2.0: A web server for multi-omics data integration to elucidate disease networks and predict therapeutics.. Nucleic Acids Res.. 2021;49(W1):W375-87. [PubMed] | [CrossRef] | [Google Scholar]
- Backes C, Keller A, Kuentzer J, Kneissl B, Comtesse N, Elnakady YA, et al. GeneTrail-advanced gene set enrichment analysis.. Nucleic Acids Res.. 2007;35(Array):W186-92. [PubMed] | [CrossRef] | [Google Scholar]
- Böschen I.. Software review: the JATSdecoder package-extract metadata, abstract and sectioned text from NISO-JATS coded XML documents; Insights to PubMed central’s open access database.. Scientometrics.. 2021;126(12):9585-601. [PubMed] | [CrossRef] | [Google Scholar]
- Tokimatsu T, Sakurai N, Suzuki H, Ohta H, Nishitani K, Koyama T, et al. KaPPA-view. A web-based analysis tool for integration of transcript and metabolite data on plant metabolic pathway maps.. Plant Physiol.. 2005;138(3):1289-300. [PubMed] | [CrossRef] | [Google Scholar]
- Shen K, Tseng GC.. Meta-analysis for pathway enrichment analysis when combining multiple genomic studies.. Bioinformatics.. 2010;26(10):1316-23. [PubMed] | [CrossRef] | [Google Scholar]
- Xia J, Fjell CD, Mayer ML, Pena OM, Wishart DS, Hancock RE., et al. INMEX-a web-based tool for integrative meta-analysis of expression data.. Nucleic Acids Res.. 2013;41(Array):W63-70. [PubMed] | [CrossRef] | [Google Scholar]
- Kuo TC, Tian TF, Tseng YJ.. 3Omics: A web-based systems biology tool for analysis, integration and visualization of human transcriptomic, proteomic and metabolomic data.. BMC Syst Biol.. 2013;7:64 [PubMed] | [CrossRef] | [Google Scholar]
- Eichner J, Rosenbaum L, Wrzodek C, Häring HU, Zell A, Lehmann R., et al. Integrated enrichment analysis and pathway-centered visualization of metabolomics, proteomics, transcriptomics, and genomics data by using the InCroMAP software.. J Chromatogr B Analyt Technol Biomed Life Sci.. 2014;966:77-82. [PubMed] | [CrossRef] | [Google Scholar]
- Kaspi A, Ziemann M.. Mitch: multi-contrast pathway enrichment for multi-omics and single-cell profiling data.. BMC Genomics.. 2020;21(1):447 [PubMed] | [CrossRef] | [Google Scholar]
- Yu C, Qi X, Lin Y, Li Y, Shen B.. iODA: an integrated tool for analysis of cancer pathway consistency from heterogeneous multi-omics data.. J Biomed Inform.. 2020;112:103605 [PubMed] | [CrossRef] | [Google Scholar]
- Kamburov A, Cavill R, Ebbels TM, Herwig R, Keun HC.. Integrated pathway-level analysis of transcriptomics and metabolomics data with IMPaLA.. Bioinformatics.. 2011;27(20):2917-8. [PubMed] | [CrossRef] | [Google Scholar]
- Sun H, Wang H, Zhu R, Tang K, Gong Q, Cui J, et al. IPEAP: integrating multiple omics and genetic data for pathway enrichment analysis.. Bioinformatics.. 2014;30(5):737-9. [PubMed] | [CrossRef] | [Google Scholar]
- Kaever A, Landesfeind M, Feussner K, Mosblech A, Heilmann I, Morgenstern B, et al. MarVis-Pathway: integrative and exploratory pathway analysis of non-targeted metabolomics data.. Metabolomics.. 2015;11(3):764-77. [PubMed] | [CrossRef] | [Google Scholar]
- Nguyen T, Tagett R, Donato M, Mitrea C, Draghici S.. A novel bi-level meta-analysis approach: applied to biological pathway analysis.. Bioinformatics.. 2016;32(3):409-16. [PubMed] | [CrossRef] | [Google Scholar]
- Luo W, Pant G, Bhavnasi YK, Blanchard SG, Brouwer C.. Pathview Web: user friendly pathway visualization and data integration.. Nucleic Acids Res.. 2017;45(W1):W501-8. [PubMed] | [CrossRef] | [Google Scholar]
- García-Alcalde F, García-López F, Dopazo J, Conesa A.. Paintomics: A web based tool for the joint visualization of transcriptomics and metabolomics data.. Bioinformatics.. 2011;27(1):137-9. [PubMed] | [CrossRef] | [Google Scholar]
- Liu T, Salguero P, Petek M, Martinez-Mira C, Balzano-Nogueira L, Ramšak Ž, et al. PaintOmics 4: New tools for the integrative analysis of multi-omics datasets supported by multiple pathway databases.. Nucleic Acids Res.. 2022;50(W1):W551-9. [PubMed] | [CrossRef] | [Google Scholar]
- Grentner A, Ragueneau E, Gong C, Prinz A, Gansberger S, Oyarzun I, et al. ReactomeGSA: new features to simplify public data reuse.. Bioinformatics.. 2024;40(6):btae338 [PubMed] | [CrossRef] | [Google Scholar]
- Griss J, Viteri G, Sidiropoulos K, Nguyen V, Fabregat A, Hermjakob H., et al. ReactomeGSA-efficient multi-omics comparative pathway analysis.. Mol Cell Proteomics.. 2020;19(12):2115-25. [PubMed] | [CrossRef] | [Google Scholar]
- Canzler S, Hackermüller J.. multiGSEA: a GSEA-based pathway enrichment analysis for multi-omics data.. BMC Bioinform.. 2020;21(1):561 [PubMed] | [CrossRef] | [Google Scholar]
- Odom GJ, Colaprico A, Silva TC, Chen XS, Wang L.. PathwayMultiomics: an R package for efficient integrative analysis of multi-omics datasets with matched or un-matched samples.. Front Genet.. 2021;12:783713 [PubMed] | [CrossRef] | [Google Scholar]
- Nguyen H, Tran D, Galazka JM, Costes SV, Beheshti A, Petereit J, et al. CPA: A web-based platform for consensus pathway analysis and interactive visualization.. Nucleic Acids Res.. 2021;49(W1):W114-24. [PubMed] | [CrossRef] | [Google Scholar]
- Wu T, Hu E, Xu S, Chen M, Guo P, Dai Z, et al. clusterProfiler 4.0:. A universal enrichment tool for interpreting omics data.. Innovation (Camb).. 2021;2(3):100141 [PubMed] | [CrossRef] | [Google Scholar]
- Li C, Han J, Yao Q, Zou C, Xu Y, Zhang C, et al. Subpathway-GM: identification of metabolic subpathways via joint power of interesting genes and metabolites and their topologies within pathways.. Nucleic Acids Res.. 2013;41(9):e101 [PubMed] | [CrossRef] | [Google Scholar]
- Calura E, Martini P, Sales G, Beltrame L, Chiorino G, D’Incalci M, et al. Wiring miRNAs to pathways: A topological approach to integrate miRNA and mRNA expression profiles.. Nucleic Acids Res.. 2014;42(11):e96 [PubMed] | [CrossRef] | [Google Scholar]
- Martini P, Chiogna M, Calura E, Romualdi C.. MOSClip: multi-omic and survival pathway analysis for the identification of survival associated gene and modules.. Nucleic Acids Res.. 2019;47(14):e80 [PubMed] | [CrossRef] | [Google Scholar]
- Jiang Y, Wang D, Xu D, Joshi T.. IMPRes-Pro: A high dimensional multiomics integration method for hypothesis generation.. Methods.. 2020;173:16-23. [PubMed] | [CrossRef] | [Google Scholar]
- MacNeil SM, Johnson WE, Li DY, Piccolo SR, Bild AH.. Inferring pathway dysregulation in cancers from multiple types of omic data.. Genome Med.. 2015;7(1):61 [PubMed] | [CrossRef] | [Google Scholar]
- Odom GJ, Ban Y, Colaprico A, Liu L, Silva TC, Sun X, et al. PathwayPCA: an R/Bioconductor package for pathway based integrative analysis of multi-omics data.. Proteomics.. 2020;20(21-22):e1900409 [PubMed] | [CrossRef] | [Google Scholar]
- Ilgisonis EV, Pyatnitskiy MA, Tarbeeva SN, Aldushin AA, Ponomarenko EA.. How to catch trends using MeSH terms analysis?. Scientometrics.. 2022;127(4):1953-67. [PubMed] | [CrossRef] | [Google Scholar]
- Hsiao TK, Torvik VI.. OpCitance: Citation contexts identified from the PubMed Central open access articles.. Sci Data.. 2023;10(1):243 Op-Cit [PubMed] | [CrossRef] | [Google Scholar]