Contents
ABSTRACT
This study aims to analyze India’s publications on organic chemistry and related fields at the micro, meso, and macro levels. The study attempts to map and visualize the publications in organic chemistry from 2016 to 2020 to identify the country co-authorship, author co-authorship, bibliographic coupling of authors, keyword co-occurrence, etc. Performance analysis techniques incorporating publication-related metrics, citation-related metrics, and citation and publication-related metrics (number of cited publications, citations per publication, h-index) were utilized to analyze the publications. Further, science mapping techniques are used to investigate citation analysis, bibliographic coupling, and co-authorship analysis. Moreover, enriched bibliometric techniques meant for computational evaluation like network analysis, including cluster analysis and visualization, were used in later phases using the software VOSviewer and Biblioshiny. VOSviewer, a bibliometric mapping tool, is extensively used in scientometric studies. For analysis of performance and visualization of research hotspots in Organic Chemistry, Biblioshiny web interface through R-studio is used, which is performing intensive data mining. A total of 1804 journals are encountered in the period taken for study which obeys a non-exponential growth with the highest number of papers (370) in the year 2017 and the least (344) in the year 2020 and as per the forecasting, the highest number of publications are expected in the year 2021 (349). Analysis of prolific authors reveals that A Kumar is the most productive author in the period with 47 publications and an h-index of 12 and KR Prabhu of IISc. Bangalore is the most impactful author with 387 citations and 27.64 CPP. Journal of Organic Chemistry is the most productive journal. Trending topics of research like azo dyes and metal-organic frameworks indicate the industrial and commercial importance of organic compounds. No similar studies have been found with matching objectives with this study.
INTRODUCTION
Bibliometric indicators are considered as most efficient tools for analyzing and monitoring research performance at global, national, institutional, and individual levels.[1] This is because this incorporates both qualitative and quantitative analysis of scholarly communications. These analyses are carried out for studying the collaboration pattern, co-authorship, chronological growth of publications, research hot spots in any discipline or area, most prolific author, country, journal, and highly cited papers.[2] This is evaluated based on performance-and-citation-related metrics, science mapping techniques, enriched bibliometric techniques like network and cluster analysis, and visualization methods.[3]
The term organic means something derived from living organisms in general. Particularly, organic chemistry implies the chemistry of carbon compounds. Organic chemistry is a vibrant and progressing scientific discipline that gives a touch to many scientific areas.[4] In this discipline, the compounds are studied based on their reactivity with other compounds, their natural products, their medicinal values, and their composition. Living organisms are composed of organic chemicals starting from hair, skin, muscles, etc. are made of proteins to DNA that maintains our genetics is made of carbon, the food that we take and even the medicine is composed of organic chemicals.[5]
In the global context, India ranks eighth in chemistry research as per the data of indexed in the nature index from 1st January 2019 to 31st December 2019 for the year 2020. Out of the 112 countries participating in chemistry research, a total of 34398 got published under the banner of Nature. India, contributed 768 papers, accounting for a 2.23% share in the cumulative publications in the global context.[6] Lots of papers get published in a single year by Indian researchers in collaboration as well as sole-authored. Organic chemistry is a major area of research in India and government research funding agencies like the Department of Science and Technology, Department of Atomic Energy, Department of Biotechnology, Indian Council of Agricultural Research, Indian Council of Medical Research, Council of Scientific and Industrial Research, University Grants Commission, Defense Research and Development Organization, Department of Chemicals and Petrochemicals are granting enormous funds to universities, IITs, IIITs, national institutes of importance (like NITs, NIDs), Centrally Funded Technical Institutes (CFTIs), Research and Development organizations and institutions to carry out research and development activities for the welfare of human beings in particular and society in general. These institutes are equipped with state-of-the-art infrastructure in the form of advanced instruments and fully functional large organic chemistry laboratories so that they may run independent experiments. One of the premier databases, Nature Index indexes papers on different science subjects published in its 82 high-quality journals. This database facilitates a smooth search algorithm to get data on its publications in subgroups like collaborations, comparison of research output by different institutions, country, year-wise publication counts of a country, and top institutions in a subject of a nation. Table 1 provides the publication count top 10 nations publishing in Nature journals in chemistry and India takes the 8th position which is quite encouraging for researchers in this area.[6]
| Rank | Country | NP* |
|---|---|---|
| 1 | China | 10513 |
| 2 | USA | 6401 |
| 3 | Germany | 2680 |
| 4 | Japan | 1814 |
| 5 | UK | 1653 |
| 6 | France | 1073 |
| 7 | South Korea | 960 |
| 8 | India | 768 |
| 9 | Switzerland | 758 |
| 10 | Canada | 695 |
The scientometric analysis is done in two aspects. (i) Performance measurement. This includes publication-related metrics like total publications (TP), Sole-Authored Publications (SAP), Number of Contributing Authors (NCA), and Co-authored publications. Citation-related metrics like Total Citations (TC), Average Citations (AC), and Citations per Paper (CPP). Citation and publication-related metrics like Collaborative Index (CI),[7] Collaboration Coefficient (CC),[8] h-index,[9] g-index,[10] and Number of Cited Publications (NCP). (ii) Science Mapping. This includes Citation analysis, co-citation analysis, Bibliographic coupling, co-word analysis, and co-authorship analysis. These aspects are quite traditional and involve manual practices. So, to enrich these works another technique namely (iii) Network analysis has evolved which is completely software-driven. This involves network metrics like degree of association, betweenness centrality, eigenvector centrality, and PageRank. Cluster analysis using multidimensional scaling, hierarchical clustering, and Simple Centers Algorithm. Visualization is another component of network analysis. This is done using software like Bibliometrix R,[11] Bibexcel,[12] Gephi,[13] VOSviewer,[14] and CiteSpace.[15] Our study involves all two aspects of scientometric analysis including network analysis except for some citation and publication-related metrics and network metrics. This makes our study differs from traditional methods. Data mining is the process of sorting large set of data to identify patterns and relationships that can solve problems through analysis of data. It involves four processes. (1) Data gathering from relevant sources: Here, it is gathered from Scopus. (2) Data cleaning, preparation and transformation: here the irrelevant data is deleted and related data is downloaded in suitable format CSV (3) Data analysis, modelling, classification and forecasting with relevant software: here this is done with MS-Excel, VOSviewer and Biblioshiny R (4) Generation of report: this involves drawing conclusion from the analysis made.
LITERATURE REVIEW
Some quantitative studies on organic chemistry have been discovered that cover the idea of the emergence of organic chemistry research in India, one of them is taken to cover the period from 1907 to 1926 based on data from Chemical Abstracts by Guay in 1986.[16] Another study on quantitative analysis of alkaloid chemistry research in India with data from Chemical Abstracts from 1979 to 1987 significantly pointed out that Indian alkaloid research has increased to 3.5% of the world output in 1981.[17] CDRI (Lucknow) is the most productive institute which accounts for 16% of the total Indian output in Alkaloid research. The same pair of authors assessed the performance of Indian organic chemistry research during the 1970s and 1980s with data from Chemical Abstracts.[18] This study identified the significant work, the impact of research output based on impact per paper, high-quality papers, relative quality index, relative indicators, relative citation rates, and relative subfield cited ness. This study shows that organic chemistry research shows signs of improvements during the end of the 1980s. The popularity of organic chemistry as a specialized subject in the field of chemistry is also highlighted by Nagpal and Pant. This is followed by another study on the activity and growth of organic chemistry research in India from 1971 to 1989 with data from Chemical Abstracts with the primary focus on the comparison of world output of research publications with Indian publications during the study period, changes in fields of organic chemistry research during 1981 to 1989 and to point out the areas of strength and weakness also the growth trends of world and Indian output in organic chemistry research.[19] This study is different from the previous one in the sense that this study extensively compared the Indian output with the global context while the previous study was conducted to evaluate the research performance using citation and related metrics only. The changes observed for different sub-fields of organic chemistry are relatively similar for India and the world. Another quantitative study analyzed the global research output in Synthetic Organic Chemistry from 1998 to 2004 with data extracted from Scopus on some selected synthetic organic chemistry journals adopting relative indicators-ACI and RCI, across nationwide comparison is done at three levels of accumulations-global, Asian, and Indian.[20] The study revealed that though many countries are observed producing a high volume of literature citations are showing a decreasing trend. Small nations like the Netherlands (which contributed 1.12% to the world share of publications) though produce low volume but quality, as reflected by the number of citations. Moreover, in the Asian context, China and India compete but China wins with higher ACI and RCI than India. Another quantitative study was conducted to assess the research trends on volatile organic compounds using the literature in the Science Citation Index database from 1992 to 2007.[21] This study observed notable growth in publication output and extensive participation and collaboration at country and institutional levels, the nature of collaboration was observed to be shifted from the national level (inter-institutional level) to international levels. Benzene, toluene, and formaldehyde were mostly encountered as volatile organic compounds. Another quantitative analysis of the growth of chemical research in India from 1987 to 2007 with data from Scopus was encountered.[22] This study discovers the growth trends in Indian chemical research relative to the world and its sub-fields using Activity Index (AI). This pointed out that the Indian research effort in chemical science is more when compared to the world average (AI for India during 1987-2007 is 100.9). Indian Institute of Chemical Technology, Jadavpur University, National Chemical Laboratory, and Bhaba Atomic Research Center scores top position in Organic Chemistry, Inorganic Chemistry, applied chemistry, and miscellaneous chemistry respectively. The study also reveals that India shows low priority in organic and inorganic chemistry research in comparison to miscellaneous and applied chemistry. In an in-depth bibliometric analysis of organic chemistry research in India, comparing it with the world’s leading country using exergy, a combination of quality, and quantity of publications was discovered.[2] The research activity of organic chemistry in India is equal to the world average from 2004 to 2013, being in the 9th position after the U.S.A., Germany, and China. A scientometric analysis of Indian chemistry as reflected in Web of Science literature performance indicators like relative growth rate, doubling time, and world vs Indian output hence discovering the prolific author, year, institution, preferred journals, highly cited papers, and subject-wise productivity per year was reviewed. The performance of the institutes is also examined using the h-index and z-index.[23] Research in catalysis with data from Scopus revealed that China ranked first and India third after the USA.[24] The study is a simple tabulation of data with the number of publications only and not that too extensive like the previous studies.
These studies mentioned above are quite traditional, that is these are based on citation-and-publication-related metrics. Also, there is no single study that has done extensive analysis of co-authorship at country, organization, and author levels; co-citation analysis and co-word analysis to identify the existing areas of research and future topics in organic chemistry research based on visualization techniques like clustering and network analysis which are trending techniques of bibliometric analysis. Moreover, analysis of publications on a regional basis is of utmost importance to know the current trend and future aspects of research in the field in the region. As no recent scientometric analysis using visualization, network, and cluster analysis is not found so, this study is an attempt to fulfill this research gap.
OBJECTIVES
To evaluate the chronological growth pattern of publications in organic chemistry research in the Indian context during the period 2016 to 2020.
To analyze the co-authorship of authors and countries based on the clustering technique.
To find out the prolific sources, authors, and institutions based on total publications and citations.
To analyze the keywords to discover the trending topic of research in the field.
To test the fitness of Lotka’s law to the author’s productivity data.
METHODOLOGY
The study follows the established procedures of scientometric evaluation to analyze the Indian research trend in Organic chemistry during 2016-20. The metadata used in this study was gathered from the Scopus database which is an Elsevier product, a popular and most prominent abstract and citation database in terms of content, including bibliographic and citation information for all traditional, transdisciplinary, and interdisciplinary areas. Scopus is the best database for investigating the goal of this study. Due to its extensive and updated coverage, data from this source is regarded as the most reliable for a bibliometric investigation to expect precise and accurate results.[25] The combined databases like Scopus provide comprehensive bibliographic information of sources of all disciplines and construct a unique platform for data extraction to meet the objectives of this study. Moreover, numerous studies have been done using the data from this database.
Using a trial-and-error approach a search strategy was developed to extract data from the Scopus database. The search strategy developed is:
(TITLE-ABS-KEY ((“Organic Chemistry”) OR (“Organic Compounds”) OR (“Organic Reactions”) OR (“Organic Materials”) OR (“Hydrocarbons”) OR (“Carboxylic Acids”) OR (“Carbocyclic Compounds”) OR (“Organometallics”) OR (“Fatty Compounds”) OR (“Aromatic Compounds”) OR (“Heterocyclic Compounds”) OR (“Aliphatic Compounds”) AND NOT (“Inorganic Chemistry” AND “Physical Chemistry”) AND (LIMIT-TO (LANGUAGE, “English”) AND (LIMIT-TO (SUBJAREA, “CHEM”) AND (LIMIT-TO (PUBYEAR, 2020) OR LIMIT-TO (PUBYEAR, 2019) OR LIMIT-TO (PUBYEAR, 2018) OR LIMIT-TO (PUBYEAR, 2017) OR LIMIT-TO (PUBYEAR, 2016) AND (LIMIT-TO (AFFILCOUNTRY, “India”))).
Here, the search operator “OR” has been used to connect the relevant keywords to extract data instead of “AND” because this conjunction gives reliable search results as it includes broad coverage of the related terms in any field without exclusion of important and related publications which would be missing while using “AND”. This would incorporate irrelevant documents in search results which would affect the accuracy and precision of the results. The inclusion of all relevant publications in the search result after analysis will give an efficient outcome that will make the results of the study more precise, and accurate in turn reliable.
The irrelevant subjects like “Physics”, “Arts and Humanities”, “Sociology”, “Psychology”, “Business and Management”, “Mathematics”, “Dentistry”, “Economics”, “Pharmaceutical Science” etc. are filtered and excluded in the search results. Moreover, only the journal articles are considered for analysis, and the other forms of the document were excluded. This is because journal articles take the majority share in the cumulative document forms of publications. The metadata of 1804 articles were discovered as of 29th October 2021 and was extracted in CSV format. For the analysis of the chronological growth of publications, MS Excel is used. The period taken for the study is 2016 to 2020 because five years is sufficient to conduct extensive bibliometric analysis, moreover, the number of publications in these years is increasing manifold. In addition, the publication is at peak in these times i.e. 2016-2020 and these papers are highly cited too. This workflow of the paper is shown in Figure 1. To discover the research trend perfectly, it is utmost essential to have perfectly balanced dataset. This will increase the accuracy and precision of the results. The analysis of the co-authorship of authors and countries is done using VOSViewer.[14] The cluster analysis is efficient to determine the relationships between countries, authors, and journals based on the relationship of citations between them. The network map is obtained after data is fed into VOSViewer which shows co-citation, co-authorships, and keyword co-occurrences. The analysis of prolific authors, institutions, and journals is done by evaluating their citation and publication metrics like total papers, total citations, h-index, and Average Citation Per Paper (ACPP). Keyword co-occurrence is analyzed using the clustering technique to know the related subjects and the analysis of research hot spots and trending areas is discovered with Biblioshiny web interface through R-studio.[11] To access the Biblioshiny Web interface first R-studio must be installed with all packages and in the R console of the R-studio the following codes are entered:
| R-command in Console | Result Display |
|---|---|
| >library (bibliometrix) | To start with the biblioshiny web interface please digit: biblioshiny (). |
| >biblioshiny () | Let us to the biblioshiny web interface through the default browser. |

Figure 1:
Search strategy and procedure of data extraction scientometric analysis.
A brief description of the types of analysis performed in this study:
Productivity and Performance
The basic bibliometric studies measure productivity and performance.[26] The function of productivity quantifies the document count published in a field and performance is concerned with the evaluation of the impact of a document by considering the number of citations received.[27] Simply, if a document is cited more this means, it has more relevancy. The analysis of productivity and performance indexes allows us to recognize prolific researchers, documents as well as sources to highlight the evolution of a field and authorship patterns. Analysis of country performance is shown in Figure 2.
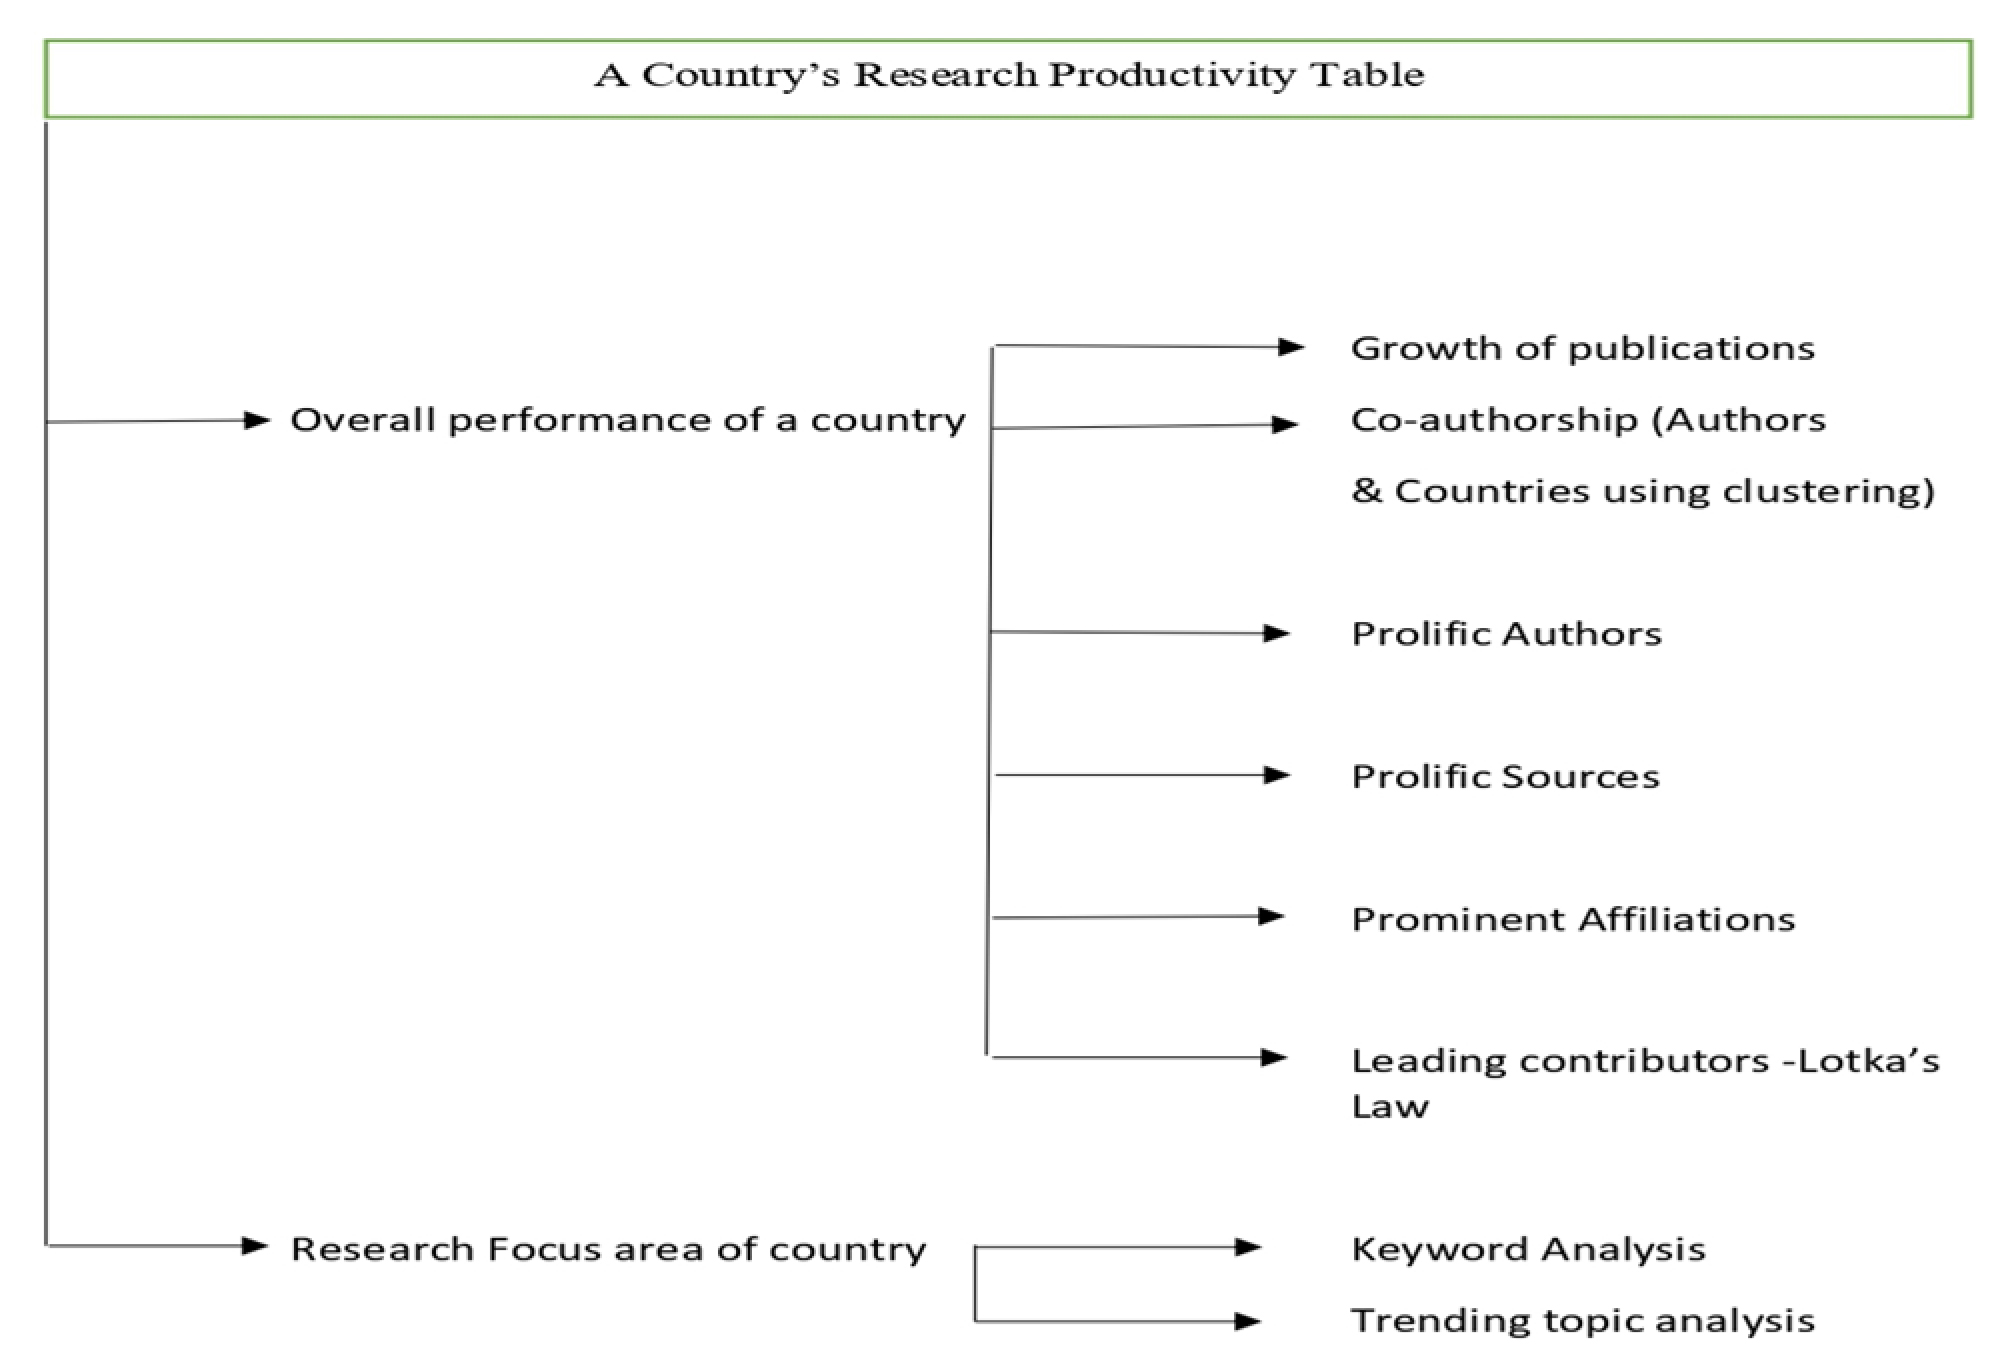
Figure 2:
Country’s performance model.
Collaboration analysis
Bibliographic data is best used to visualize the different types of networks. A well-developed collaborative network consists of nodes, which represent the units of analysis (authors, institutions, and countries) and finding the links between them when these have co-authored at least a single paper.[28] This study provides the co-authorship network between authors and countries. Figures 5 and 6 depict the co-authorship pattern of authors and countries respectively. The size of the node or circles is proportional to the number of papers published by each author or country.
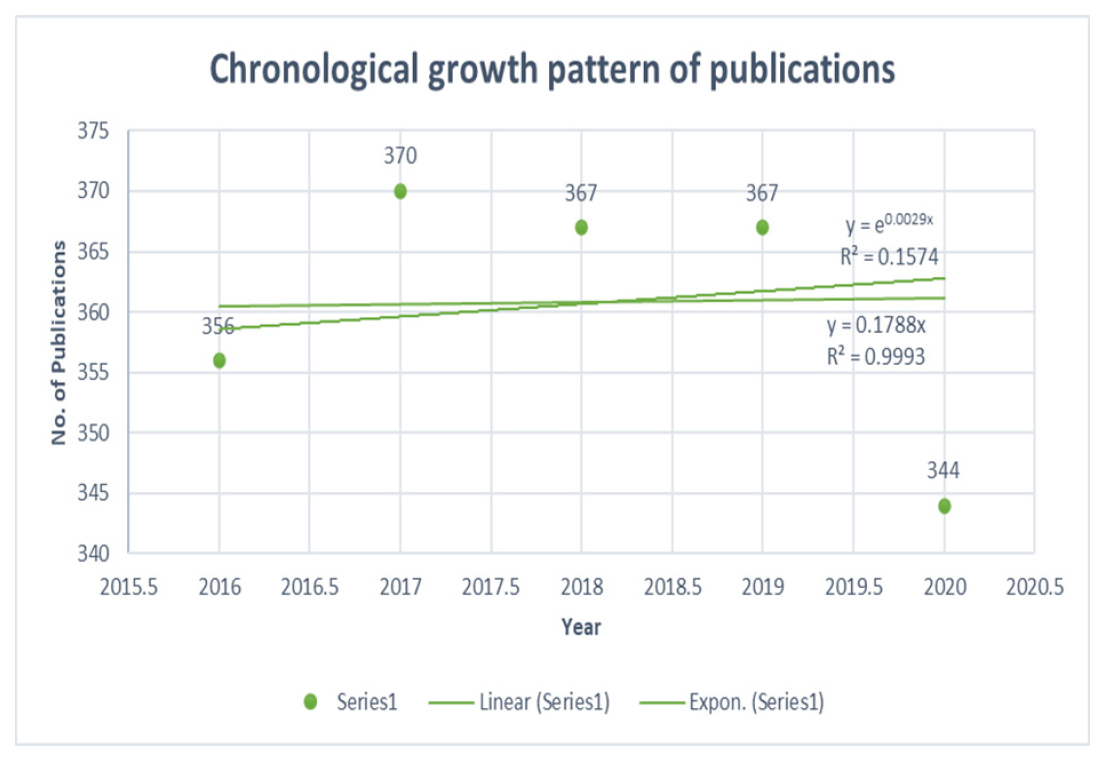
Figure 3:
Chronological growth of Publications.
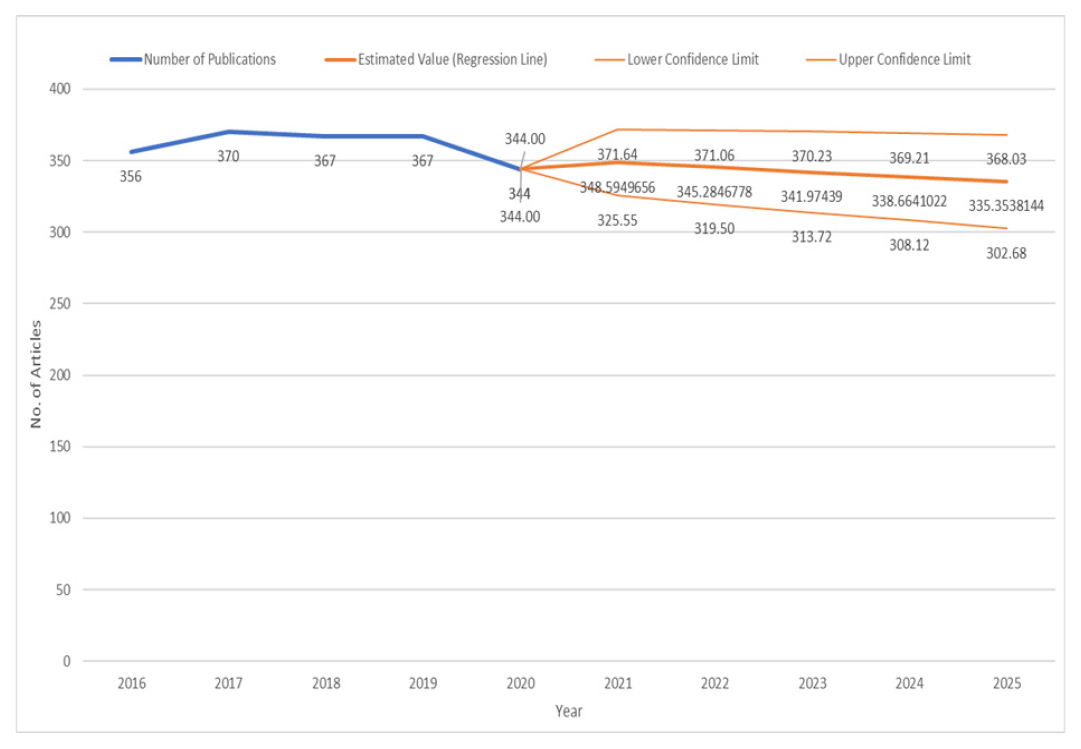
Figure 4:
Regression Analysis was used to predict the number of publications in the ensuing 5 years i.e., 2021 to 2025 based on data from the previous five years i.e., 2016 to 2020.
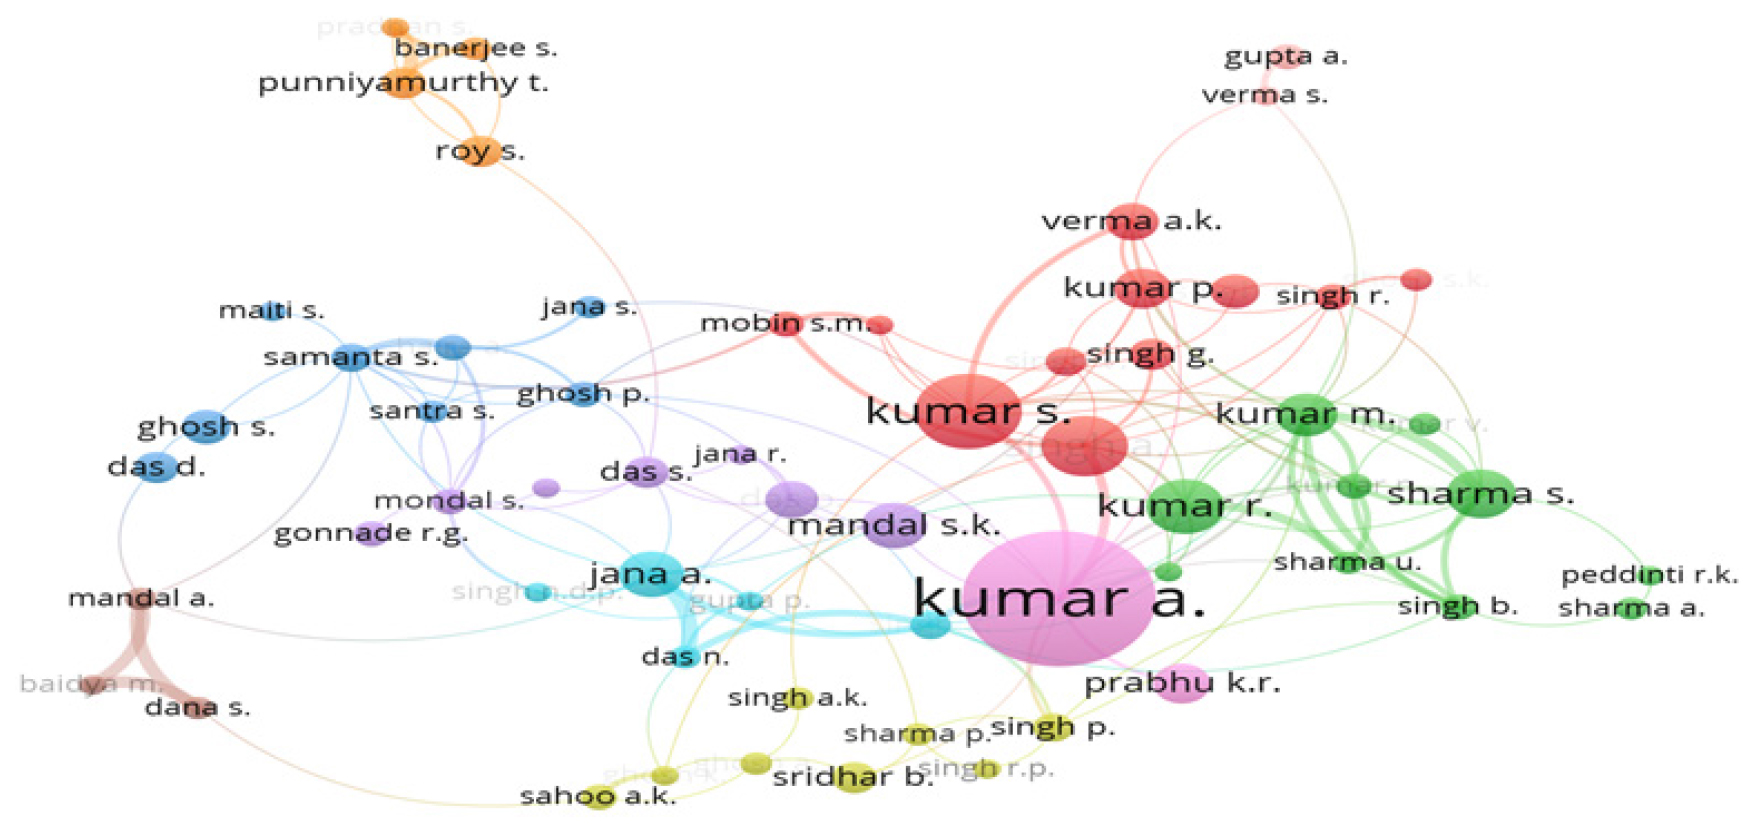
Figure 5:
Network Visualization of co-authorship of authors.
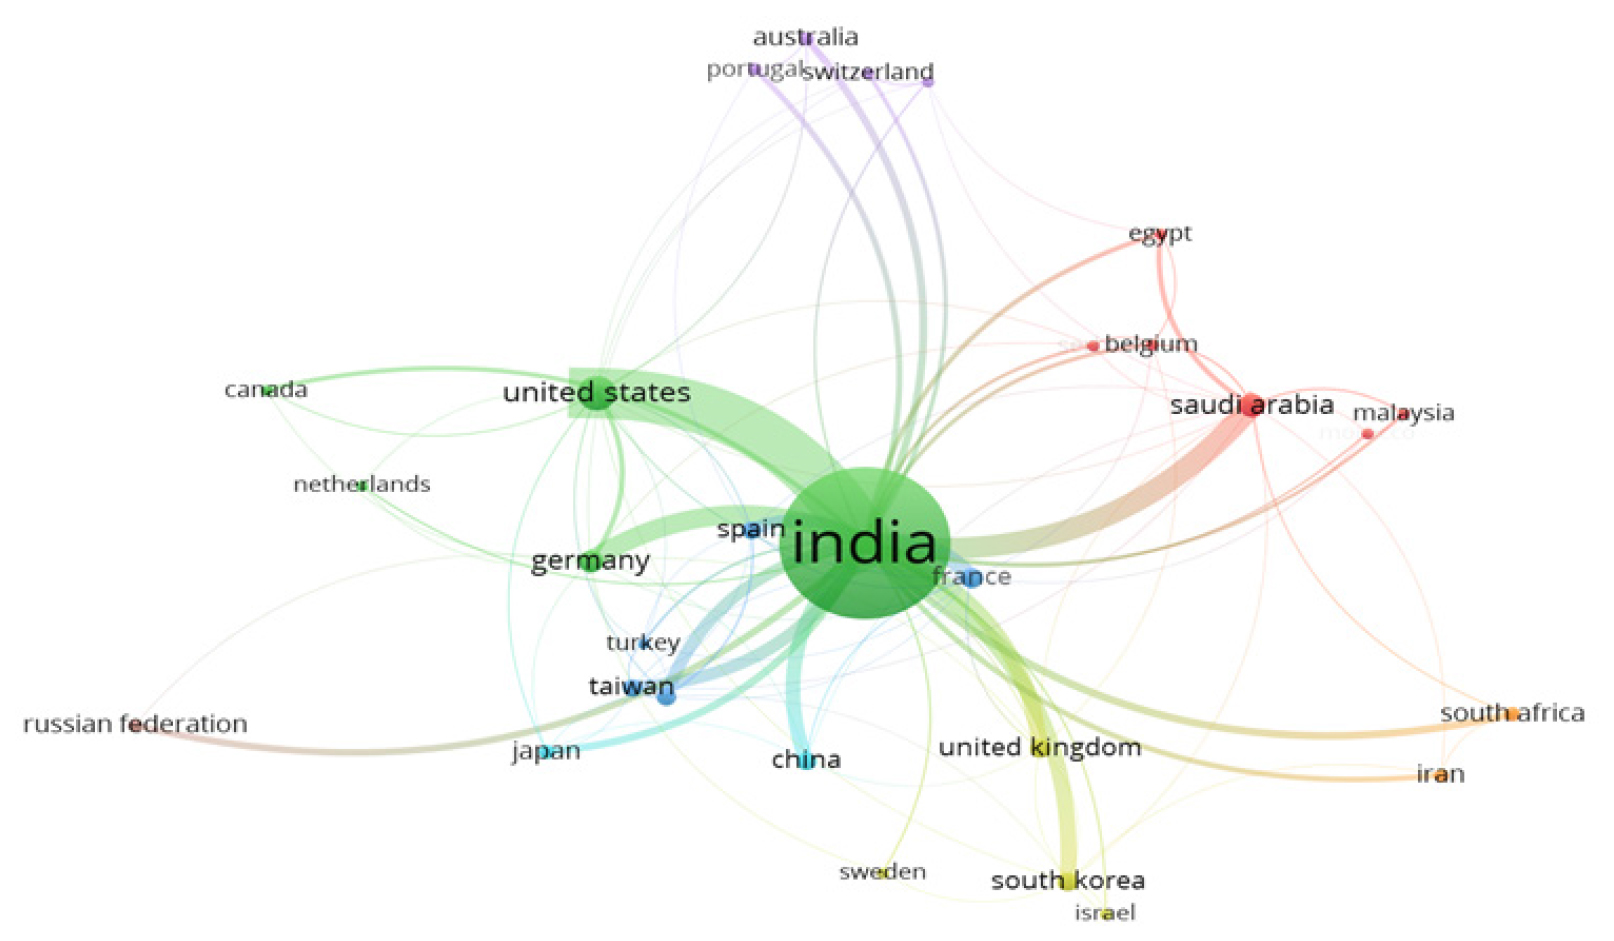
Figure 6:
Network Visualization of co-authorship of countries.
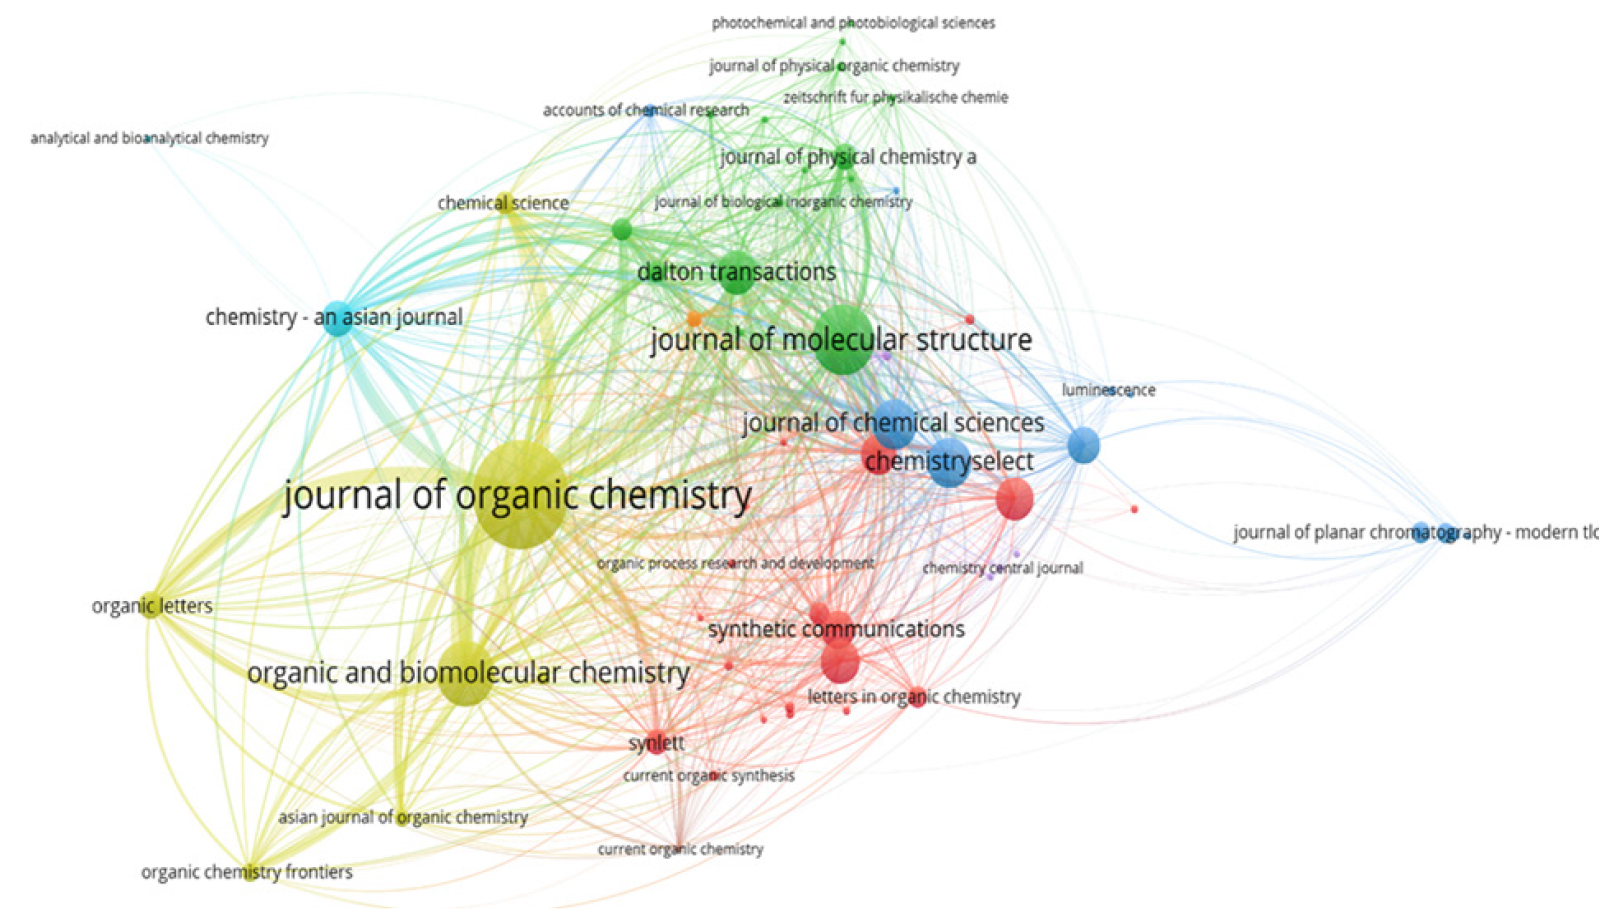
Figure 7:
Bibliographic Coupling of Prolific Journals.
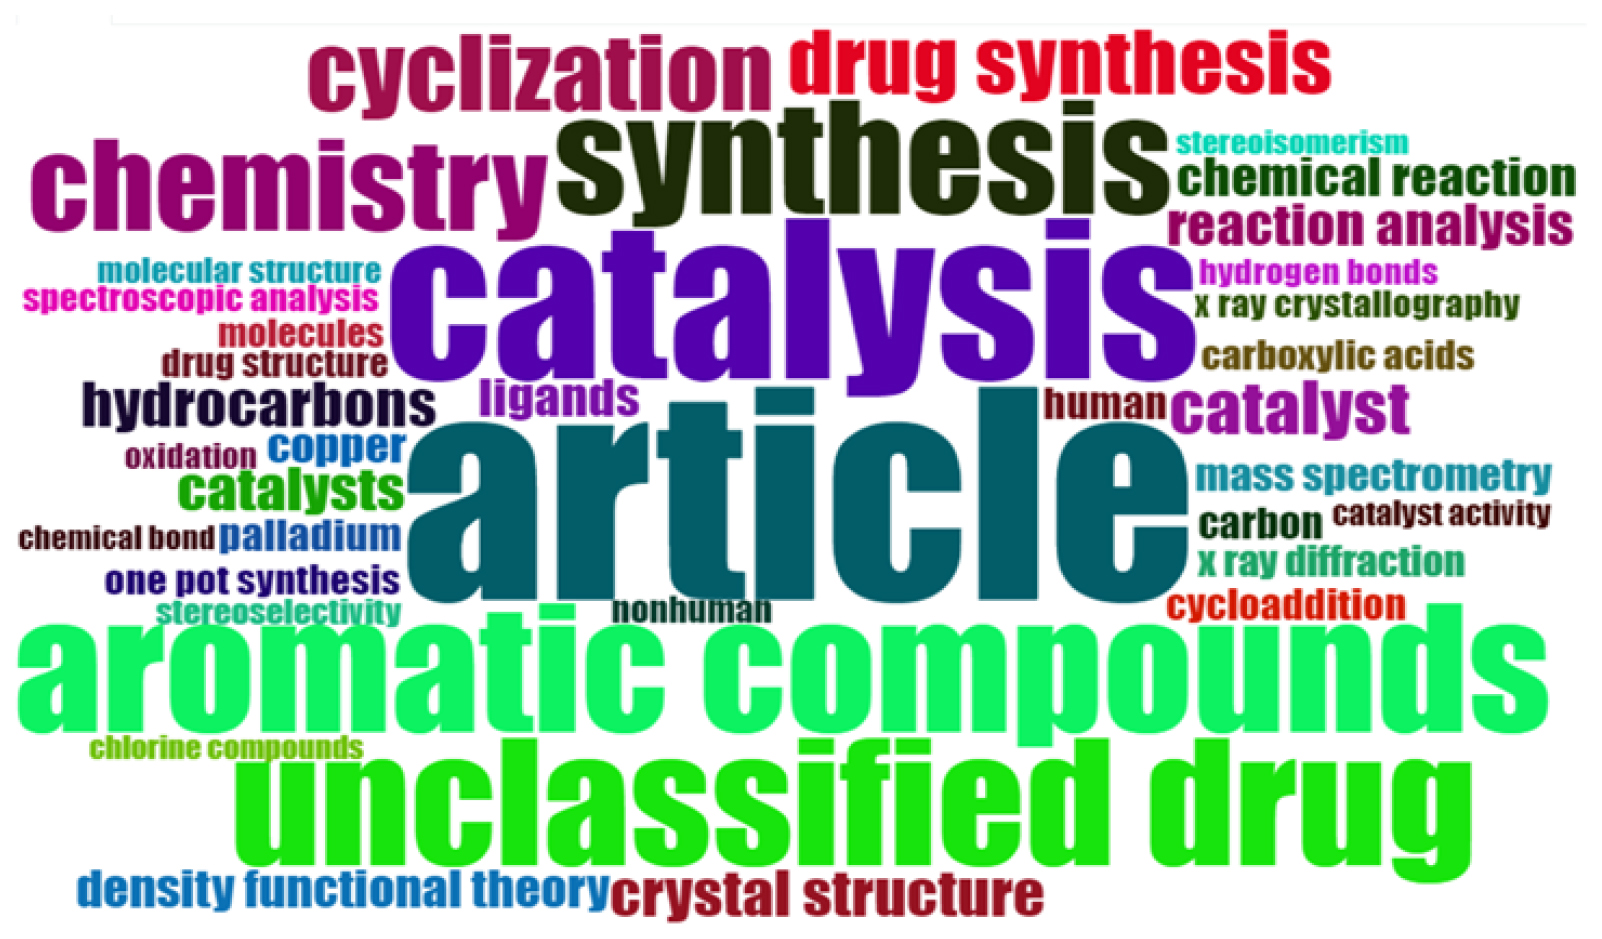
Figure 8:
Word Cloud of prominent Keywords.
Co-word analysis
This considers the co-occurrence of keywords in publications on a given subject. This provides the number of times that two or more keywords co-occur in a paper.[29] This depicts the actual content of the research papers present in the publications. Each circle in Figure 9 represents a keyword, the size of which is proportional to the keyword co-occurrences in the sample of papers. The lines connect the common keywords that appear simultaneously in a paper. If the size of the node is bigger than it means that the number of occurrences of the keyword is also high.
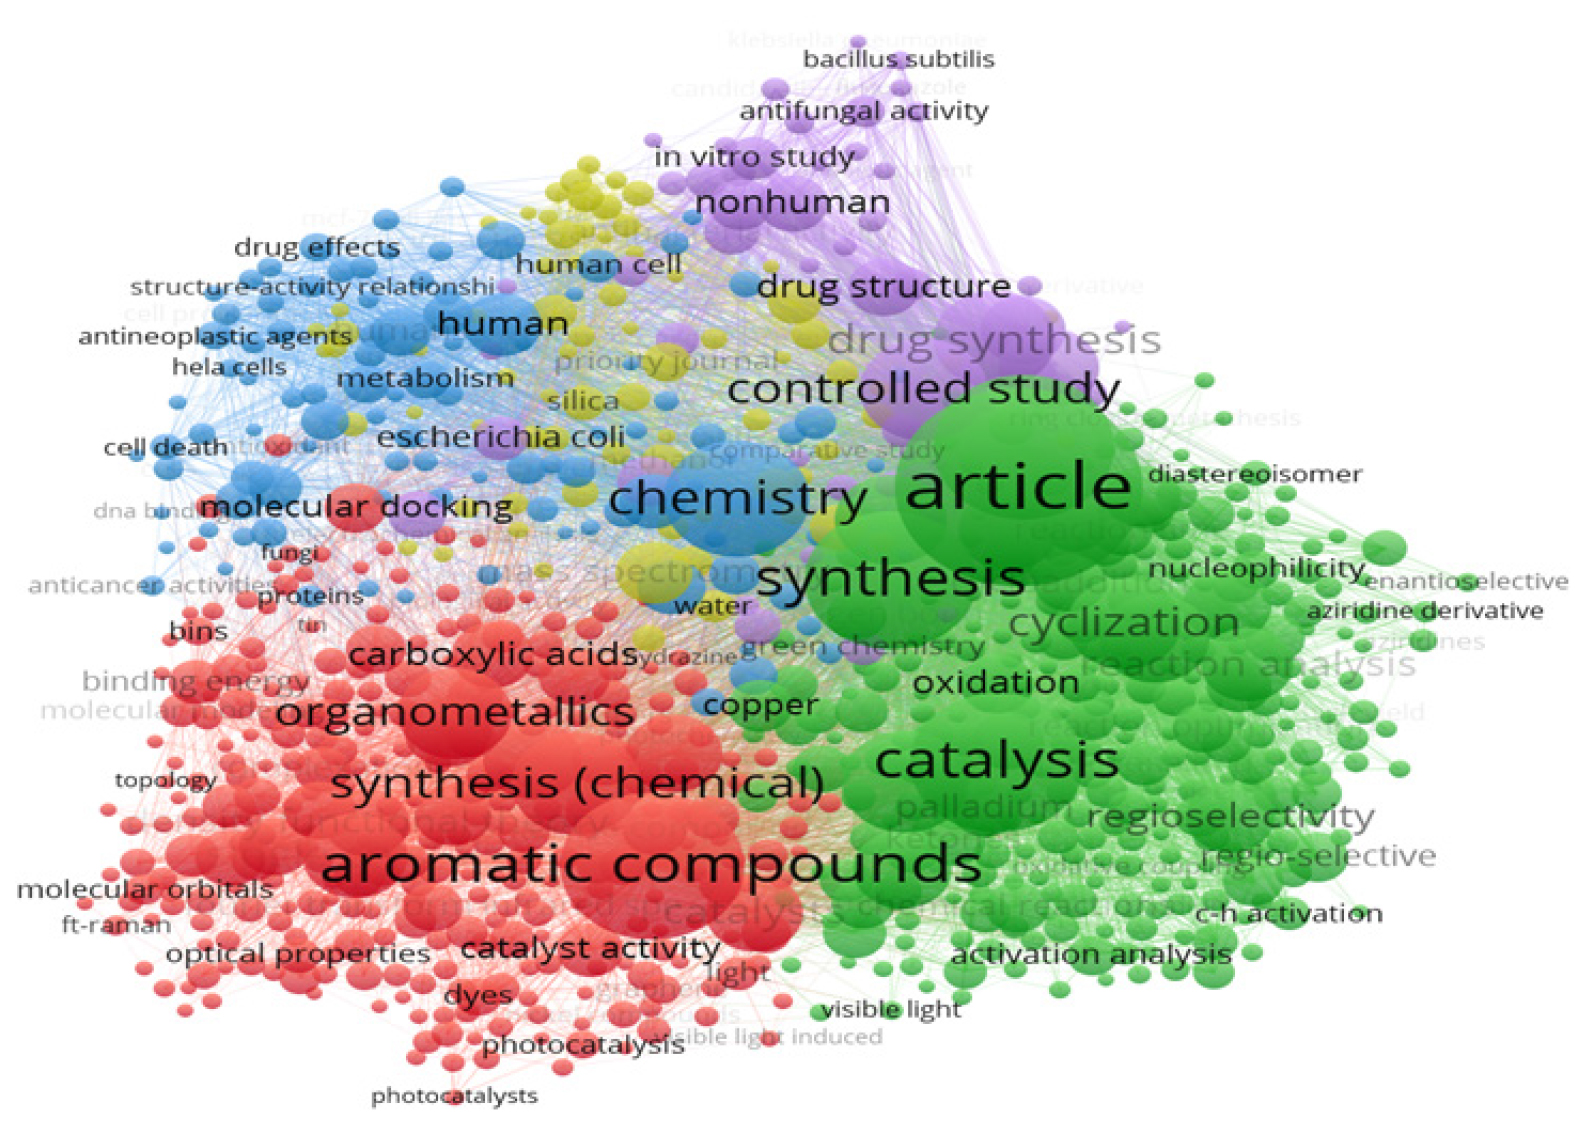
Figure 9:
Network Visualization of prominent keywords in Indian Organic Chemistry Research during 2016-2020 based on a Clustering technique developed with VOSViewer.
RESULTS
Evaluation of the chronological growth pattern of publications in organic chemistry research in the Indian context during the period 2016 to 2020
As depicted in Figure 3, the growth of publications is not consistent from the initial year considered for the study i.e., 2016. The growth of papers is highest in the year 2016-17 (14 papers) and in the successive years, the growth is negative. There is a tie in the number of publications in the years 2018 and 2019 (367 papers). The last paper is observed in the year 2020 (344 papers) which is even lower than the initial year 2016 (356 papers). The year 2017 has the highest number of papers of all the 5 years taken for study (370 papers). The consistency of publications can also be examined using the Price Law[30] as applied by Okoroiwu et al. 2020.[31] The price law of exponential growth is analyzed in two phases: first, the linear trendline is estimated, here it is: y=0.1788x, and the exponential trendline is represented with the equation: y=e0.0029x. The correlation coefficient (R2) for these lines is estimated. If the Price law is satisfied then it will imply that the growth rate is exponential. It is so if the correlation coefficient of the exponential curve is greater than that of the linear trendline. Here the correlation coefficient of the exponential curve (R2=0.1574) is strictly less than that of the linear curve (R2=0.9993) which implies the growth of publications is non-exponential. Figure 4 gives an estimated number of publications in the ensuing 5 years i.e., 2021 to 2025 using regression analysis. According to the results of this analysis, it was forecasted that approximately 349 articles (CI: 326-372), 345 articles (CI: 320-371), 342 articles (CI: 314-370), 339 articles (CI: 308-369) and 335 articles (CI: 303-368) would be published in 2021, 2022, 2023, 2024 and 2025 respectively.
Analysis of Co-authorship of authors and countries using clustering technique
Using standard algorithm as, counting method: full counting, units of analysis (author, organization, countries), visualization scale as 1.0, weights as documents, size variations as 0.50, circles as display nodes, maximum length as 30 and font as open sans, the analysis is performed using VOSViewer. Multiple Scaling method is used as a default method for creating various Figure 5, 6, 7 and 9 as mentioned in the following sections.
Co-authorship of authors
The most common form of analysis of collaboration networks is the co-authorship analysis. This can be done with three units of analysis viz., co-authorship of authors, countries, and organizations. The analysis of the co-authorship of authors is done to identify the collaboration network of authors in a specific field. These networks are discovered with the raw data fed into VOSviewer and to get transparent network maps, the normalization method used is “Association Strength”. The authors with a minimum of 7 documents are taken to identify the network and 67 out of 5279 authors meet this threshold. Among these 67 authors, only 60 authors are found to be connected and these authors are divided into 10 clusters with each cluster with a minimum of 2 authors. Each cluster can be separated based on differences in color as depicted in Figure 5. The authors in close collaboration are in a common cluster and each circle represents a single author with their name. The size of the circle is proportional to the number of documents published by the author. Some curved lines are the links that connect the two circles, which shows the cooperative relationship between the two authors. The thickness of the link implies the intensity of cooperation. Let us see the authors in the common network cluster-wise. Cluster 1 (Red) has 11 authors in all. Some of them are A.K. Verma, S. Kumar, G. Singh, R. Singh, S.M. Mobin, V. Singh, and S.K. Singh. Cluster 2 (green) has 10 authors in all.
Some of them are M. Kumar, S. Sharma, U. Sharma, B. Singh, R. Kumar, and R.K. Peddinti. Cluster 3 (blue) has 8 authors in total. Some of them are S. Samanta, S. Maiti, S. Ghosh, D. Das, S. Maiti, and P. Ghosh. This is followed by Cluster 4 (yellow) has 8 authors. Some of them are A.K. Singh, P. Sharma, B. Sridhar, A.K. Sahoo, and R.P. Singh. Cluster 5 (Violet) has 7 authors in all. They are P. Das, S. Das, M.K. Ghorai, R.G. Gonnade, R. Jana, S.K. Mandal, and S. Mandal. Cluster 6 (shallow blue) has 5 authors in all. These are N. Das, P. Gupta, A. Jana, K. Singh, N.D.P. Singh. The 7th cluster (orange) has 4 authors: S. Banerjee, S. Pradhan, T. Punniyamurthy, and S. Roy. 8th cluster (brown) has 3 authors: M. Baidya, S. Dana, and A. Mandal. The 9th cluster (purple) has 2 authors: A. Kumar and K.R. Prabhu and the last cluster i.e., the 10th cluster (shallow red) A. Gupta and S. Verma.
Co-authorship of countries
Analysis of co-authorship of countries reveals the network of collaborating countries. Moreover, it also provides information on the workplace of a researcher, the nation in which an author has the affiliated organization where he works and produces papers. Analysis of co-authorship, be it of countries or authors is very significant in the case of multi-authored papers where each author has almost similar contribution as this facilitates the visualization of the research collaboration network. Figure 6 is created by taking a minimum of 3 documents by a country and using this threshold a total of 29 countries are found to be connected. These countries are further divided into 8 clusters represented with different colors in the Figure 6. The circles (or nodes) represent a country and the thickness of the lines connecting each country depicts the strength of cooperation between them. If the thickness is more than the strength of co-operation between the connected countries is more and vice-versa. Let us present the analysis of clusters. Cluster 1 (Red) has 6 countries in connection: Belgium, Egypt, Malaysia, Morocco, Saudi Arabia, and Serbia. Cluster 2 (Green) has 5 countries namely, Canada, Germany, India, Netherlands, and United States. Cluster 3 (Blue) has also had 5 countries: France, Italy, Spain, Taiwan, and Turkey. The 4th Cluster (Yellow) is with 4 countries: Israel, South Korea, Sweden, and the United Kingdom. Cluster 5 (Violet) has 4 countries: Australia, Mexico, Portugal, and Switzerland. Cluster 6 (Shallow Blue) and Cluster 7 (Orange) have 2 countries each: China and Japan; Iran and South Africa respectively. Cluster 8 (Brown) has only Russian Federation in its club.
Prolific Sources
The prolific sources in Indian organic chemistry research are listed in Table 1. These are tabulated based on the number of publications as a primary indicator and total citations as the secondary one. The distribution of the publications in the top productive sources is highly skewed. These top 10 sources produce 1117 papers in all and take 61.92% share in cumulative publications (1804) with 111.7 papers per journal as the group average. While the top 5 journals in the list have a group average of 156.6 papers which is higher than that of the total group average (111.7). These journals received cumulative citations of 16791 with 1679.1 citations per journal as the group average. The most productive journal (based on several publications) is the Journal of Organic Chemistry (319) with total citations and citations per paper (CPP) as 3412 and 10.7 respectively. If the impact of the journal is taken into consideration, then the Journal of Molecular Structure topped with 4127 citations with 26.97 CPP for 153 publications.
The networking and clustering are done for bibliographic coupling network maps using a state-of-the-art VOSviewer tool meant for the purpose. The analysis is done by taking a minimum of 3 documents per source. Of the 130 sources, 62 are found to have a minimum of 3 documents to get bibliographically coupled. For these sources, the total strength of the bibliographic coupling links with other sources is calculated. The sources with the greatest total link strength are selected and highlighted. These journals are grouped into 8 clusters based on the common network of bibliographic coupling, represented with identical color. For instance, cluster 1 (Red) has 19 journals, like the Journal of Heterocyclic Chemistry, Letters in Organic Chemistry, Synthetic Communications, Synlett, etc. Cluster 2 (green) has 15 journals; some are Dalton Transactions, Journal of Molecular Structure, Organometallics, Analytical Chemistry, etc. Cluster 3 (deep blue) has 13 journals to be bibliographically coupled. Some are the Journal of Chemical Sciences, Luminescence, Asian Journal of Chemistry, Chemistry Select, etc. Cluster 4 (shallow yellow) has 7 items in common like the Journal of Organic Chemistry, Organic and Biomolecular Chemistry, Organic Letters, Organic Chemistry Frontiers, etc. The 5th cluster (violet) has Chemistry Central Journal, Journal of Inorganic Biochemistry, Russian journal of general chemistry, and Journal of chromatography b. Cluster 6 (shallow blue) has 2 journals-chemistry: an Asian journal, Analytical and bioanalytical chemistry. Cluster 7 (orange) and cluster 8 (brown) have 1 journal each respectively inorganic chemistry and Current Organic Chemistry (Figure 7).
Prolific Author
The total number of publications contributed by the top 10 most prolific authors as listed in Table 2 in Indian organic chemistry research during 2016-2020 is 207 and the total citations received by these publications is 2249 with 10.86 citations per author which is the group average. Authors with at least 14 or more publications can have their names on this list. These authors are listed based on their performance and citation-related metrics namely, total publications, total citations, citations per paper, and h-index. The group’s average number of publications is 20.7 which are lower than the average number of papers for authors in the top 5 which is 26.4. With the group average (of 20.7) these authors produced a total of 207 papers which accounts for an 11.5% share in cumulative publications (1804). As per the total citations is considered the average citations received per author is 224.9 and the top 5 author’s average citations are 242.2. These two analyses reveal that the dataset for prolific authors is highly skewed. The productive author is A Kumar with 47 publications and a CPP of 10.34 which is an average score. This author has an h-index of 12 which means that he is an impactful researcher. But based on citations KR Prabhu affiliated with IISc, Bangalore topped the list with 387 citations (27.64 CPP and h-index of 10) for his 14 publications only which is the lowest in the list.
| Sl. No. | Name of Journal | IF* | Quartile | Publisher | NP* | TC** | CPP*** |
|---|---|---|---|---|---|---|---|
| 1 | Journal of Organic Chemistry | 3.6 | Q1 | ACS* | 319 | 3412 | 10.7 |
| 2 | Journal of Molecular Structure | 3.8 | Q1 | Elsevier | 153 | 4127 | 26.97 |
| 3 | Organic and Biomolecular Chemistry | 3.2 | Q1 | RSC* | 136 | 2542 | 18.69 |
| 4 | Chemistry Select | NA | Q2 | Wiley | 88 | 869 | 9.88 |
| 5 | Journal of Chemical Sciences | 1.7 | Q3 | Springer | 87 | 1558 | 17.91 |
| 6 | Journal of Heterocyclic Chemistry | 2.4 | Q3 | Wiley | 73 | 914 | 12.52 |
| 7 | Dalton Transactions | 4.0 | Q1 | RSC | 72 | 820 | 11.39 |
| 8 | Research on Chemical Intermediates | 3.3 | Q2 | Springer | 69 | 872 | 12.64 |
| 9 | Applied Organometallic Chemistry | 3.9 | Q2 | Wiley | 63 | 1012 | 16.06 |
| 10 | Synthetic Communications | 2.1 | Q3 | T&F* | 57 | 665 | 11.67 |
| Name | Affiliation | NP | TC | CPP | HI* |
|---|---|---|---|---|---|
| A Kumar | DAV University, Jalandhar. | 47 | 486 | 10.34 | 12 |
| S Kumar | MMM College, Patiala. | 26 | 255 | 9.8 | 10 |
| A Singh | Jawaharlal Nehru Center for Advanced Scientific Research, Bangalore. | 23 | 191 | 8.3 | 6 |
| R Kumar | IIT Bombay. | 19 | 148 | 7.79 | 8 |
| S Sharma | MS University, Udaipur. | 17 | 131 | 7.71 | 7 |
| A Jana | TIFR Center for Interdisciplinary Sciences, Hyderabad. | 16 | 155 | 9.69 | 9 |
| SK Mandal | Visva-bharti University. | 16 | 265 | 16.56 | 10 |
| M Kumar | Central Drug Research Institute, Lucknow. | 15 | 136 | 9.07 | 7 |
| P Kumar | Central University of Punjab. | 14 | 95 | 6.79 | 5 |
| KR Prabhu | IISc Bangalore. | 14 | 387 | 27.64 | 10 |
Prominent Affiliations
Analysis of prominent affiliations gives the status of research and development which are the core activities of any R&D organization, institution, university, or institute of national importance. The highly productive institutions demand research of quality and training human resources to maintain consistency in the long run. Contribution to the development of human society, to improve the standard of living makes them sustainable. Table 3 listed the top 10 most productive institutions which produced a total of 1105 papers (61.26% share in cumulative publications, 1804) with 110.5 papers per affiliation as an average. Institutions with at least 78 or more papers are on this list. The premier Indian Institute of Science, Bangalore topped the list with 173 publications. The IIT system has been in top positions in research since its inception and the prestigious Indian Institute of Technology Guwahati is on the top list of all IITs with 118 publications. There are four IITs in the list which contributed 389 papers in all with a group average of 97.25 papers, slightly near to the group average. As per impact, based on Average Citations Per Paper (ACPP) or simply Citations Per Paper (CPP) Indian Institute of Bombay has the highest value of 61.71 with its least 86 papers of all. This is followed by IIT Madras (61.49). The number of papers in the top 5 is 667 and the total citations received by these papers is 36477. These authors receive a CPP of 54.69 which is lower than that of the CPP for the top 10 authors (56.2 for 62102 cumulative citations for 1105 papers). There is the observation of distinct skewness in the distribution of papers in the top 10 authors.
| Sl. No. | Name | NP | TC | ACPP |
|---|---|---|---|---|
| 1 | Indian Institute of Science | 173 | 10346 | 59.8 |
| 2 | CSIR- Indian Institute of Chemical Technology | 149 | 8774 | 58.89 |
| 3 | University of Delhi | 123 | 4466 | 36.31 |
| 4 | Indian Institute of Technology Guwahati | 118 | 6889 | 58.31 |
| 5 | Osmania University | 104 | 6002 | 57.71 |
| 6 | Indian Institute of Technology Madras | 93 | 5719 | 61.49 |
| 7 | Indian Institute of Technology Kharagpur | 92 | 4837 | 52.58 |
| 8 | University of Hyderabad | 89 | 5004 | 56.22 |
| 9 | Indian Institute of Technology Bombay | 86 | 5307 | 61.71 |
| 10 | Institute of Chemical Technology Mumbai | 78 | 4758 | 61 |
Analysis of Keywords
A bibliometric review is incomplete without an analysis of keywords. Keywords reflect the research area concerned in a paper. These are an indispensable part of any research publication. Analysis of keywords has been performed in three phases. First, keywords with prominent occurrences are identified. Second, analysis of keywords based on cluster followed by an analysis of year-wise growth of the top 10 highly occurring keywords and analysis of trending topics.
As listed in Table 4 the top 10 most prominent keywords are based on the frequency of occurrence. The highest occurring keyword related to the subject is Catalysis (404) and at least occurring in the list is Organic compounds (166). Figure 8 depicts the prominent keywords. The font size of the letters of the keywords in the Figure 8 is directly proportional to the frequency of occurrence of the keywords. As clearly visible the keywords in Table 4 are of larger font size due to their higher frequency of occurrence than the ones with low font size in the Figure 8.
| Rank | Keyword | Frequency |
|---|---|---|
| 1 | Article | 539 |
| 2 | Catalysis | 404 |
| 3 | Aromatic Compounds | 326 |
| 4 | Unclassified Drug | 320 |
| 5 | Synthesis | 287 |
| 6 | Chemistry | 231 |
| 7 | Cyclization | 195 |
| 8 | Synthesis (Chemical) | 184 |
| 9 | Controlled Study | 178 |
| 10 | Organic Compounds | 176 |
The analysis of the keyword network is performed using VOSViewer. Figure 9 represents the network of keywords, which are divided into 5 major clusters based on their co-occurrence. Circles represent a keyword and the size of each circle is proportional to the number of occurrences of the keyword. Taking a minimum number of occurrences of keywords as 7, it was found that a total of 819 keywords are found to meet this threshold. These 5 clusters can be identified in the Figure 9 based on differences in their colors. Cluster 1 (Red) has 297 keywords in total. This cluster is on general organic chemistry processes. Some of them are Aromatic Compounds, Organometallics, Carboxylic Acids, Synthesis (Chemical), and Catalyst Activity. Cluster 2 (Green) has 294 keywords that represent organic processes like Synthesis, Catalysis, Cyclization, Nucleophilicity, and Oxidation. Cluster 3 (blue) has 100 keywords giving insights on biological organic chemistry like drug effects, human, cell death, animals, biochemistry, cell survival, and chemistry. Cluster 4 (yellow) has 75 keywords all of which highlight the chromatographic processes, some are Silica Gel, Thin layer chromatography, Limit of detection, high-performance thin-layer chromatography, and chromatographic analysis. Lastly, Cluster 5 (Violet) has 53 keywords representing drug-designing aspects like Anti-fungal activity, anti-biotic agent, drug synthesis, thiazole derivative, and antibacterial activity.
Figure 10 was created using the Biblioshiny with graphical parameters: field as “keyword plus”, occurrences “per year” with no confidence interval with the top 10 keywords considering the maximum frequencies. It reveals the growth of prominent keywords on an annual basis from 2016 to 2020. The highest occurring keyword “article” has its maximum frequency in the year 2016 (125). The second most highly occurring keyword “catalysis” has a maximum frequency of 101 in both 2016 and 2017 (Table 5).
| Year | Article | Catalysis | Aromatic Compounds | Unclassified Drug | Synthesis | Chemistry | Cyclization | Synthesis (Chemical) | Controlled Study | Organic Compounds |
|---|---|---|---|---|---|---|---|---|---|---|
| 2016 | 125 | 101 | 59 | 82 | 77 | 66 | 45 | 27 | 46 | 39 |
| 2017 | 113 | 101 | 72 | 63 | 63 | 59 | 50 | 50 | 36 | 54 |
| 2018 | 101 | 65 | 69 | 53 | 55 | 39 | 40 | 33 | 35 | 33 |
| 2019 | 104 | 69 | 56 | 61 | 45 | 35 | 32 | 38 | 24 | 30 |
| 2020 | 96 | 68 | 70 | 61 | 47 | 32 | 28 | 36 | 37 | 20 |
| Total | 539 | 404 | 326 | 320 | 287 | 231 | 195 | 184 | 178 | 176 |
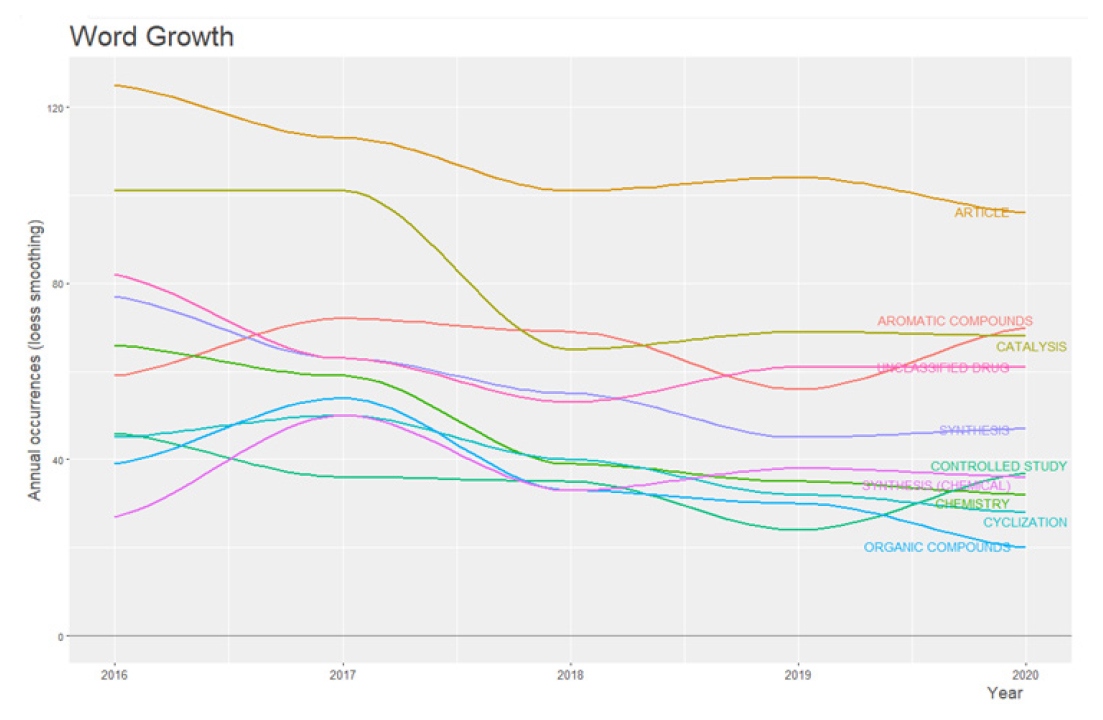
Figure 10:
Year-wise word occurrence of top 10 highly occurring keywords.
Figure 11 represents the prominent areas of research based on the number of occurrences of the keywords on yearly basis. Hence, keeping a look at this Figure 11 reveals the trending areas of research in Indian organic chemistry in recent 2020. Table 6 gives the list of trending prominent keywords with their number of occurrences every year. The trending topics of research are “Energy Dispersive Spectroscopy”, “Metal-Organic Frameworks”, “Excited States”, “Azo Dyes” and “Ketone”. These keywords are with maximum occurrences in the year 2020. The prominence of these keywords indicates a positive trend in organic chemistry research toward Spectroscopy and synthetic organic chemistry.
| Year | Drug Effects | Animal | Animals | Anti-fungal agent |
|---|---|---|---|---|
| 2016 | 22 | 18 | 18 | 15 |
| 2017 | Chemistry | Organic Compounds | Drug Synthesis | Chemical Structure |
| 231 | 176 | 166 | 146 | |
| 2018 | Catalysis | Aromatic Compounds | Unclassified Drug | Synthesis |
| 404 | 326 | 320 | 287 | |
| 2019 | Amides | Fourier Transform Infrared Spectroscopy | Thin Layer Chromatography | High-Performance Thin Layer Chromatography |
| 57 | 52 | 47 | 40 | |
| 2020 | Azo Dyes | Excited States | Metal-Organic Frameworks | Energy Dispersive Spectroscopy |
| 14 | 13 | 13 | 12 |
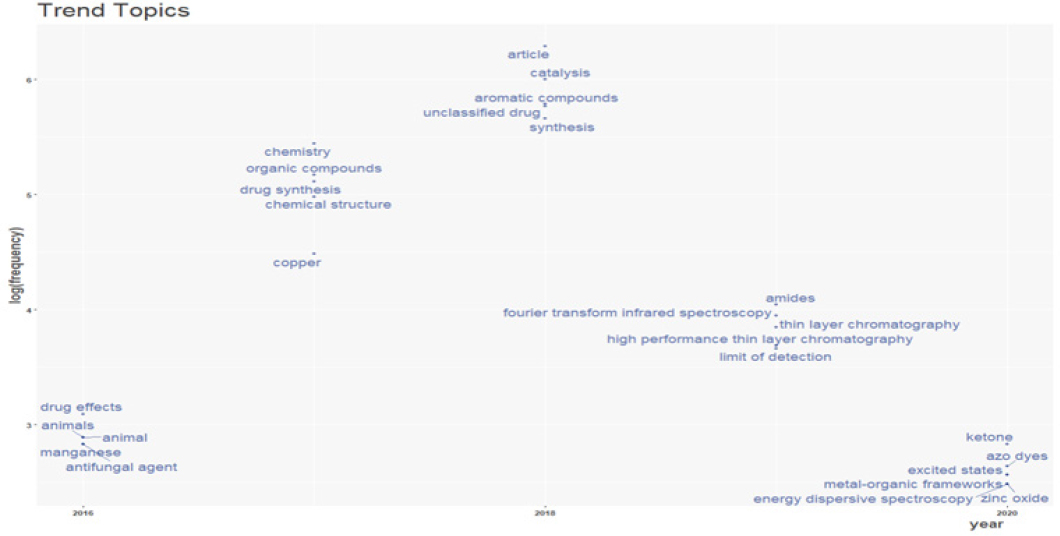
Figure 11:
Trending Topics in Indian Chemistry research during 2016-2020.
Appropriateness of Lotka’s Law
Lotka was the first to observe and analyze the productivity patterns of Authors in a data sample from Chemistry and Physics.[32] He came up with a general formula known as Lotka’s law which can be written as:
Where y is the frequency of authors making n contributions each and k is a constant. Lotka’s Inverse Square Law can be mathematically written as,
where g(x) is the proportion of authors making x contributions.
A generalized form of Lotka’s Law was formulated by Bookstein[33] as,
Where, g represents a fraction of authors publishing x articles, k and n are the parameters to be estimated from the data, xmax rrepresents the maximum size or value of productivity variable x and n is usually greater than or equal to 1.
This law was employed in several studies in order to know whether the number of authors observed and anticipated is in the same order or not. Studies like Borgohain et al. (2021) applied this law to assess the scientific productivity of authors in the field of Nanotechnology research.[34] Das and Verma (2021) applied Lotka’s law in the publications of Digital Library and observed that the law is not appropriate to the dataset.[35] Similarly, a study was conducted by (Sudhier 2013) to test the fitness of Lotka’s law in the Physics literature.[36] This study was designed to apply the law using Chi-square and K-S statistical tests. But unfortunately, the law did not hold well to this dataset too. Let us see the application of this law.
Using the straight count method
Estimation of the parameter ‘n’
Using the Linear Least Square (LLS) method the value of ‘n’ is calculated using the formula,
To evaluate ‘n’, x=number of articles and g(x) is the fraction of authors publishing x articles.
Table 7 shows the calculation done.
| x | g(x) | ln (x) | ln g (x) | ln (x) ln g (x) | ln (x) * ln (x) |
|---|---|---|---|---|---|
| 1 | 4190 | 0.0000 | 8.3404 | 0.0000 | 0.0000 |
| 2 | 668 | 0.6931 | 6.5042 | 4.5081 | 0.4804 |
| 3 | 214 | 1.0986 | 5.3700 | 5.8994 | 1.2069 |
| 4 | 93 | 1.3863 | 4.5330 | 6.284 | 1.9218 |
| 5 | 41 | 1.6094 | 3.7135 | 5.9765 | 2.5902 |
| 6 | 29 | 1.7918 | 3.3672 | 6.0333 | 3.2114 |
| 7 | 15 | 1.9459 | 2.7080 | 5.2694 | 3.7866 |
| 8 | 17 | 2.0794 | 2.8332 | 5.8914 | 4.3239 |
| 9 | 11 | 2.1972 | 2.3970 | 5.2667 | 4.8287 |
| 10 | 5 | 2.3025 | 1.6094 | 3.7056 | 5.3015 |
| Total | 5283 | 15.1042 | 41.3759 | 48.8344 | 27.6514 |
Putting the values from the Table 7 in equation (4), ‘n’ can be evaluated as,
Calculation of value ‘k’
The value of k representing the theoretical number of authors with a single arlicle is determined with the formula:
Where, p is an assumed value as taken to be 20. As soon as n and k are determined, using Eq. (3), the number <( auth<rs writing 1, 2, 3, ………x articles can be determined.
The value <( parameter n is calculated as, n= -2.8238
Putting the value <( n, the value <( k is determined (r<m the Table 7 <( exp<nents given by R<usseau (1993)[37] as, k= 0.7
Fractional Value of expected number of authors
This is evaluated using the Eq (3) and the values are calculated are shown in Table 8 in column 6.
| x | g(x) | FOF | CFOC | FEF | CFEF | DOECF |
|---|---|---|---|---|---|---|
| 1 | 4190 | 0.7931 | 0.7931 | 0.7000 | 0.7000 | 0.0931 |
| 2 | 668 | 0.1264 | 0.9195 | 0.1608 | 0.8608 | -0.0587 |
| 3 | 214 | 0.0405 | 0.9600 | 0.0614 | 0.9222 | 0.0378 |
| 4 | 93 | 0.0176 | 0.9776 | 0.0325 | 0.9547 | 0.0229 |
| 5 | 41 | 0.0077 | 0.9853 | 0.0198 | 0.9745 | 0.0108 |
| 6 | 29 | 0.0055 | 0.9908 | 0.0105 | 0.9850 | 0.0058 |
| 7 | 15 | 0.0028 | 0.9936 | 0.0075 | 0.9925 | 0.0011 |
| 8 | 17 | 0.0032 | 0.9968 | 0.0063 | 0.9988 | -0.002 |
| 9 | 11 | 0.0020 | 0.9988 | 0.0057 | 1.0045 | -0.0057 |
| 10 | 5 | 0.0009 | 0.9997 | 0.0023 | 1.0068 | -0.0071 |
Using K-S statistical test for checking the fitness of Lotka’s law to the dataset
As per the recommendation of Coile (1977),[38] K-S statistical test was used to test the fitness of the law.[30] For the application of this test, normalization of the observed and expected number of authors is required which is done by converting the value of the observed and expected number of authors into fractional values and taking the difference between cumulative fractional values of the observed and expected number of authors as shown in Table 8. The maximum difference value, Dmax, which represents the maximum deviation is found as 0.0378.
The critical value of D in K-S test at 5% level of significance is 0.654. While comparing with the actual value of D, 0.0378 with the critical value 0.654, it has been found that the actual value of D is far away from the critical value. So, Lotka’s law does not fit the author productivity distribution of the first 10 authors.
DISCUSSION
The bibliometric investigation turned out to be an effective and reliable means for summarizing the current status and forecasting the future development trends in the knowledge domain of any research area.[39,40] An enriched bibliometric technique is the creation of network visualization maps by using tools meant for the purpose like VOSviewer[14] and Biblioshiny.[11] These maps created are based on information science, computer science, scientometrics, and applied mathematics, and analysis of these figures created highlights the developmental process and thematic relationship of knowledge in a certain field.[41,42] Hence, by using bibliometric and visualization analysis, the patterns of research on Indian organic chemistry from 2016 to 2020 have been identified discovering the main publications, prolific countries, authors, and journals based on performance-and-citation-related metrics and analysis of research hot spots with visualization techniques.
The number of publications has increased manifold from 2016 to 2020 in Indian organic chemistry research as indicated by the Price Law. A total of 1804 research papers are encountered in the period which follows a linear growth pattern. India is seen to have close cooperation with the United States, Netherlands, Canada, and Germany, all being in a common cluster. China, Japan, and Iran are in a common cluster and are productive nations too. Thus, it can be boldly predicted that in the ensuing years the number of publications can increase manifold and this has been certified by the Scopus database.
h-index is an important indicator to quantify the academic output and status of a scientist. For instance, if an author has an h-index n, it means that he/she has n publications that have received n citations or even more.[43] Here, these performance and citation-related metrics have been used intensively to quantify the scholarly output and rank the top individuals. Parallel to the h-index, the total citations received also plays a significant role in measuring the scholarly performance of individual units of analysis per the h-index is considered, A Kumar is the most prolific author with an h-index of 12 and receiving the highest number of citations. The highest average citations are received by the Journal of Molecular Structure (CPP=26.97) and total citations of 4127. The articles on this area of research appear in the Journals of Organic Chemistry. These journals are with high impact factor and attract papers of high quality and the publication of excellent papers also in turn uplifts the academic impact of these journals.
In any form of research in contemporary science, collaboration among scientists, researchers, and development organizations in all strata (micro or macro levels) plays a pivotal role in expanding R&D activities. This aspect is evaluated with co-authorship analysis. This refers to the evaluation of the relationships among items through the number of co-authored documents. It was implemented to evaluate the cooperation between individual authors, institutions, and countries. The thickness of the connecting line determines the strength of closeness between the units of analysis. The analysis shows that India is the center of research which has close cooperation between the U.S., Canada, and the Netherlands in a common cluster. Lotka’s law has been attracting the interest of bibliometrics time and again. It is deployed to know the frequency of publication by authors in any field.[32] The study of fitness of the Lotka’s law began with the work of Pao with 48 sets of data with author productivity with the linear least square method.[44] Many studies have been encountered which have discovered the application of Lotka’s law to various subject areas. So, this has been applied to the dataset of Indian organic chemistry research to see the validity but the result is found to be negative. The results of this review will be useful for scientists and researchers of organic chemistry in India as they will be supplied with sufficient information on the status of organic chemistry research in India based on authentic data from Scopus. Several studies have been discovered to perform bibliometric analysis of publications on organic chemistry but those studies have limited their analysis to traditional bibliometric practices like analysis as per performance using publication-related metrics, citation-related metrics, and publication and citation-related metrics. But not a single latest study has been encountered to analyze the Indian publications on organic chemistry using visualization tools for science mapping and network analysis (cluster analysis and visualization using tools like VOSViewer or Biblioshiny or CiteSpace or Gephi).
A typical bibliometric study on any subject domain reveals sources, affiliations, authors, countries, and keywords of prominence based on the number of publications, total citations, h-index, g-index, etc. These are traditional measurements to rank the units of analysis. Now, enriched bibliometric techniques have evolved like cluster analysis, and network visualization which facilitates visualization of the research network. Here, the analysis of co-authorships of the two units-authors and countries reveal the collaboration network among the researchers in the field of organic chemistry. Another aspect of bibliometric/scientometric analysis is the science mapping techniques which involve the task of analyzing the bibliographic coupling, co-citation analysis, and co-word analysis which has not been performed in this study. Extensive analysis of the social behavior of the researchers in organic chemistry in India has not been conducted here which turns out to be a limitation of the study leaving ample scope for future study. In bibliometrics, the analysis of frequently occurring keywords can reveal the hot spot categories and development of a research topic.[45] As per the analysis of keyword cooccurrence performed using VOS viewer, all keywords are divided into 5 major clusters: “Organic Compounds”, “Biochemistry”, “Catalysis”, “Chromatography” and “Drug Synthesis”. These five clusters represent the main direction of research in the field of organic chemistry. It is noteworthy that keywords related to catalysis and drug synthesis are combined into a common cluster. The change process of the field was to the progress of drug synthesis techniques. Therefore, the scientific community seemed to take a special interest in catalysis and drug development.
CONCLUSION
From this scientometric analysis, it can be concluded that the growth in the number of papers in the period taken for study (2016-2020) is not satisfactory as chemistry research is funded by several agencies motivated the purpose to explore new knowledge in this domain. Now, it is a good sign for India that it has close collaboration with the superpower of the world U.S.A. Researchers from IISc Bangalore have proved their efficiency and ability to keep the premier institute’s name in the list of top 10. KR Prabhu, a professor of organic chemistry at the Department of Chemistry IISc Bangalore is the most influential author with 387 citations for only his 14 publications, which is indeed appreciable. Journal of Organic Chemistry (IF2020=4.35) is the most productive source for attracting and publishing articles of quality. IISc, Bangalore again topped in the productive affiliation category which reflects the hard work and commitment of the researchers in the institute. The trending topics of research identified by the number of occurrences of keywords in the recent year 2020 are Metal-Organic Framework, Energy Dispersive Spectroscopy, and Azo dyes. Metal-organic frameworks are coordination compounds with organic ligands containing potential voids. These are used in gas purification, catalysis, and gas separation. The occurrence of this keyword for a maximum time in recent years is indicative of the fact that organic chemistry research has gone more diversified with the inclusion of coordination chemistry. Azo Dyes are much important commercially and are used to treat textiles, leather articles, and edible items. The occurrence of this keyword in trend topics is a positive sign as it looks at the wide application of this class of compounds making them commercially available to meet the demand in the market. This will contribute to the Indian economy to a great extent.
Cite this article:
Borgohain DJ, Bhardwaj RK, Verma MK. Computational Mapping of Indian Organic Chemistry Research: An Analysis with Data Mining Tools. J Scientometric Res. 2024;13(1):176-91.
References
- Borgohain DJ, Sohaimi Z, Verma MK. Cluster analysis and network visualization of global research on digital libraries during 2016-2020: A bibliometric mapping. Sci Technol Libr. 2021;40(3):1-22. [Google Scholar]
- Salini C, Nishy P, Vishnumaya R, Mini S. A bibliometric evaluation of organic chemistry research in India. Ann Libr Inf Stud. 2014;61(4):332-42. [Google Scholar]
- Donthu N, Kumar S, Mukherjee D, Pandey N, Lim WM. How to conduct a bibliometric analysis: an overview and guidelines. J Bus Res. 2021;133:285-96. [CrossRef] | [Google Scholar]
- Smith MB, March J. March’s advanced organic chemistry. 2007 [CrossRef] | [Google Scholar]
- McMurry J. Organic chemistry. 2012 [CrossRef] | [Google Scholar]
- [cited Jun 28, 2022];Natureindex.com. Available from: https://www.natureindex.com/country-outputs/generate/chemistry/global
[CrossRef] | [Google Scholar] - Lawani SM. Quality, collaboration and citations in cancer research: a bibliometric study. Florida State University School of Information Studies. 1980 [CrossRef] | [Google Scholar]
- Ajiferuke I, Burell Q, Tague J. Collaborative co-efficient: a single measure of the degree of collaboration in research. Scientometrics. 1988;14(5-6):421-33. [CrossRef] | [Google Scholar]
- Hirsch JE. An index to quantify an individual’s scientific research output. Proc Natl Acad Sci U S A. 2005;102(46):16569-72. [PubMed] | [CrossRef] | [Google Scholar]
- Egghe L. An Improvement of the h-index. The G-Index ISSI Newsl. 2006;2(1):8-9. [PubMed] | [CrossRef] | [Google Scholar]
- Aria M, Cuccurullo CC. bibliometrix: An R-tool for comprehensive science mapping analysis. J Inf. 2017;11(4):959-75. [CrossRef] | [Google Scholar]
- . Celebrating scholarly communication studies: A Festschrift for Ille Persson at his 60th Birthday. 2009:9-24. [CrossRef] | [Google Scholar]
- Betisan M, Heymann S. Jacomy M. Gephi: an open-source software for exploring and manipulating networks. 2009;3:361-62. [CrossRef] | [Google Scholar]
- van ECK NJ, Waltman L. Software Survey: VOSviewer, computer program for bibliometric mapping. Scientometrics. 2010;84(2):523-38. [PubMed] | [CrossRef] | [Google Scholar]
- Chen C. CiteSpace II: Detecting and visualizing emerging trends and transient patterns in scientific literature. J Am Soc Inf Sci Technol. 2006;57(3):359-77. [CrossRef] | [Google Scholar]
- Guay Y. Emergence of basic research on the periphery: organic chemistry in India, 1907-1926. Scientometrics. 1986;10((1-2)):77-94. [CrossRef] | [Google Scholar]
- Karki MM, Garg KC. Bibliometrics of alkaloid chemistry research in India. J Chem Inf Comput Sci. 1997;37(2):157-61. [CrossRef] | [Google Scholar]
- Karki MM, Garg KC. Scientometrics of Indian organic chemistry research. Scientometrics. 1999;45(1):107-16. [CrossRef] | [Google Scholar]
- Karki MM, Garg KC, Sharma P. Activity and growth of organic chemistry research in India during 1971-1989. Scientometrics. 2000;49(2):279-88. [CrossRef] | [Google Scholar]
- Kumari GL. Synthetic Organic Chemistry Research: analysis by scientometric indicators. Scientometrics. 2009;80(3):559-70. [CrossRef] | [Google Scholar]
- Zhang G, Xie S, Ho YS. A bibliometric analysis of world volatile organic compounds research trends. Scientometrics. 2010;83(2):477-92. [CrossRef] | [Google Scholar]
- Varaprasad SJD, Ramesh D. Activity and Growth of chemical research in India during 1987-2007. DESIDOC J Libr Inf Technol. 2011;31(5):387-94. [CrossRef] | [Google Scholar]
- Hosamani S, Bagalkoti V. Scientometric Analysis of Indian Chemistry Literature as reflected in Web of Science Database. Int J Soc Sci. 2016;5(2):6-17. [CrossRef] | [Google Scholar]
- Ciriminna R, Simakova IL, Pagliaro M, Murzin DY. A scientometric analysis of catalysis research. J Scientometr Res. 2020;9(3):335-43. [CrossRef] | [Google Scholar]
- Borgohain DJ, Verma MK, Daud SC. Scientometric profile of fisheries research in SAARC countries. DESIDOC Jl Lib Info Technol. 2021;41(6):429-37. [CrossRef] | [Google Scholar]
- Herrera GT, Fernandez Bajon MT, Moya-Anegon FD. Output, collaboration and impact of e-learning research: bibliometric analysis and visualisations at the country and institutional level (Scopus 2003-2016). El Prof Inf. 2018;27(5):1082 [CrossRef] | [Google Scholar]
- Salcedo MG, Martinez MA, Moral-Munoz JA, Herrera-Viedma E, Cobo MJ. Some bibliometric procedures for analysing and evaluating research fields. Appl Intell. 2018;48(5):1275-87. [CrossRef] | [Google Scholar]
- Borgohain DJ, Nazim M, Verma MK. Cluster analysis and network visualization of research in mucormycosis: a scientometric mapping of the global publications from 2011 to 2020. Libr Hi Tech. 2020 [ahead-of-print] (no. ahead-of-print). [CrossRef] | [Google Scholar]
- Ding Y, Chowdhury GG, Foo S. Bibliometric cartography of Information Retrieval Research by using Co-word Analysis. Inf Process Manag. 2001;37(6):817-42. [CrossRef] | [Google Scholar]
- Price D. Little science, big science. 1963 [CrossRef] | [Google Scholar]
- Okoroiwu HU, Munoz FL, Montero FP. Bibliometric analysis of global sickle cell disease research from 1997 to 2017. Hematol Transfus Cell Ther. 2020;44(2):186-96. [CrossRef] | [Google Scholar]
- Lotka A. The frequency distribution of scientific productivity. J Wash Acad Sci. 1926;16(12):317-25. [CrossRef] | [Google Scholar]
- Bookstein A. The bibliometric distributions. Libr Q. 1976;46(4):416-23. [CrossRef] | [Google Scholar]
- Borgohain DJ, Mansor AN, Verma MK. Nanotechnology research in SAARC nations during 1996 to 2020: A scientometric assessment based on Scopus database. Libr Philos Pract. 2021:4941 [CrossRef] | [Google Scholar]
- Das S, Verma MK. Digital library research in BRICS countries during 2000-2019: a scientometric analysis. Ann Libr Inf Stud. 2021;68:127-34. [CrossRef] | [Google Scholar]
- Sudhier KGP. Lotka’s law and pattern of author productivity in the Area of Physics Research. DESIDOC J Libr Inf Technol. 2013;33(6):457-64. [CrossRef] | [Google Scholar]
- Rousseau R. A table for estimating the exponent in Lotka’s law. J Doc. 1993;49(4):409-12. [CrossRef] | [Google Scholar]
- Coile RC. Lotka’s frequency distribution of scientific productivity. J Assoc Inf Sci Technol. 1977;28(6):365-72. [CrossRef] | [Google Scholar]
- Grant MJ, Booth A. A typology of reviews: an analysis of 14 review types and associated methodologies. Health Info Libr J. 2009;26(2):91-108. [PubMed] | [CrossRef] | [Google Scholar]
- Møller AM, Myles PS. What makes a good systematic review and meta-analysis?. Br J Anaesth. 2016;117(4):428-30. [PubMed] | [CrossRef] | [Google Scholar]
- Synnestvedt MB, Chen C, Holmes JH. CiteSpace II: visualization and knowledge discovery in bibliographic databases. AMIA Annu Symp Proc. 2005;2005:724-28. [PubMed] | [Google Scholar]
- Gu D, Li T, Wang X, Yang X, Yu Z. Visualizing the intellectual structure and evolution of electronic health and telemedicine research. Int J Med Inform. 2019;130(103947) [PubMed] | [CrossRef] | [Google Scholar]
- Merigó JM, Yang JB. A bibliometric analysis of operations research and management science. Omega. 2017;73:37-48. [CrossRef] | [Google Scholar]
- Pao ML. An empirical examination of Lotka’s law. J Am Soc Inf Sci. 1986;37(1):26-33. [CrossRef] | [Google Scholar]
- Wu H, Tong L, Wang Y, Yan H, Sun Z. Bibliometric analysis of global research trends on ultrasound microbubble: A quickly developing field. Front Pharmacol. 2021;12(646626) [PubMed] | [CrossRef] | [Google Scholar]
